On April 15, a White House fact sheet on the initiation of a security investigation into key mineral-importing countries stated that, due to China's retaliatory actions, Chinese products could face tariffs as high as 245%. The U.S. government has recently intensified tariff measures against China, continuing and reinforcing long-standing trade barrier policies, with tariff escalations since 2025 particularly highlighting this trend. Specifically:
February 1: Trump signed an executive order imposing an additional 10% tariff on Chinese goods exported to the U.S., citing the "fentanyl issue," bringing the combined tariff rate to 20% when added to the previous 301 tariffs. Simultaneously, the tariff exemption for packages valued below $800 (Section T86) was revoked, though the duty-free policy for packages under $800 was reinstated three days later (February 7), while retaining tariffs on high-value packages.
March 4: The additional tariff was increased from 10% to 20%, covering a wide range of sectors including electronics, machinery, and chemicals, with some products facing combined tariff rates exceeding 40%.
March 26: A 25% tariff was imposed on imported complete vehicles, with tariffs on parts set to take effect by May 3 (only applicable to non-U.S. components under the USMCA).
April 5: A 10% base tariff was imposed on all trading partners.
April 8: The U.S. raised the previously announced 34% so-called "reciprocal tariff" on Chinese goods exported to the U.S. by an additional 50% to 84%. Combined with previous rates, some products saw their total tariff rates rise to 104%. Subsequently, Trump decided to further escalate tariffs on China, increasing the rate from 104% to 125%, effective immediately. According to a White House executive order, the actual tariff rate on Chinese products reached 145%.
April 15: A White House fact sheet on the initiation of a security investigation into key mineral-importing countries stated that, due to China's retaliatory actions, Chinese products could face tariffs as high as 245%.
It's really crazy! Many in the market are also concerned whether this will significantly impact the price of iron ore, which has the strongest financial attributes among black commodities.
According to iron ore import data from the General Administration of Customs, China's iron ore imports from the U.S. have remained at a low level since 2010. Among them, imports peaked in 2012 at 4.73 million mt, accounting for 0.64% of total iron ore imports that year. From 2015 to 2020, imports significantly declined, with the lowest point in 2019 at only 130,000 mt. Although imports rebounded to around 1 million mt after 2021 due to increased iron ore demand in China, their share of total imports remained at an extremely low level of 0.1%, indicating minimal dependence on U.S. iron ore.
Chart: China's Iron Ore Imports from the U.S. and Their Share (10,000 mt)
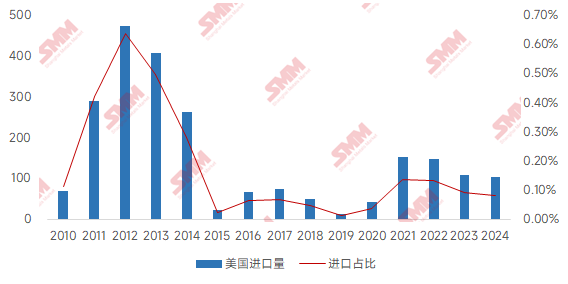
Data Source: General Administration of Customs, SMM
The global iron ore import landscape exhibits a clear resource-oriented characteristic, with major import sources being countries with large reserves and production: Australia and Brazil have long dominated, accounting for over 80% combined, followed by resource-rich countries such as India, South Africa, and Peru. In contrast, the U.S. has weaker iron ore resource endowments, with its 3 billion mt of raw ore reserves being only one-seventh of China's (China's reserves are approximately 20 billion mt), and its average ore grade of 33% slightly inferior to China's 34.5%. This resource endowment difference is directly reflected in trade data—in 2024, China's iron ore imports from the U.S. accounted for only 0.08% of total imports, while Australia and Brazil accounted for 83% of China's imports.
Chart: 2024 China Iron Ore Import Share by Country
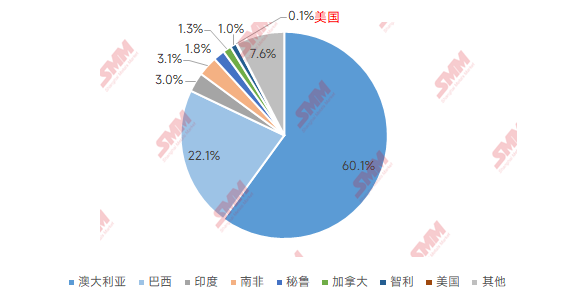
Data Source: General Administration of Customs, SMM
U.S. iron ore production is not high, with peak production in 2000 at approximately 64 million mt. Subsequently, due to the closure of some high-cost mines, production declined, with 2023 production at around 46 million mt and 2024 production at approximately 47 million mt. Its main production areas are concentrated in the Great Lakes region, with Minnesota as the core production area producing about 32 million mt annually, Michigan producing 7 million mt, and Missouri producing a small amount of magnetite. However, the U.S. domestic iron ore consumption is 55 million mt annually, resulting in a supply-demand gap of about 8 million mt, primarily supplemented by imports from Canada and Brazil.
From a trade perspective, the U.S. exports a very limited amount of iron ore concentrate to China, meaning that U.S.-China tariff policies have minimal actual impact on China's iron ore imports. The global iron ore market is already facing supply surplus pressure, and with the commissioning of large projects such as Simandou, the surplus situation may further intensify. In this context, as the world's largest iron ore importer, China will continue to prioritize purchasing low-cost, high-quality resources from mainstream mining areas such as Australia and Brazil, with minimal necessity to import from the U.S. Overall, SMM believes that the impact of the U.S.-China tariff war is mainly on steel exports and will not directly affect the iron ore supply-demand balance.
Chart: U.S. Iron Ore Production and Exports (10,000 mt)
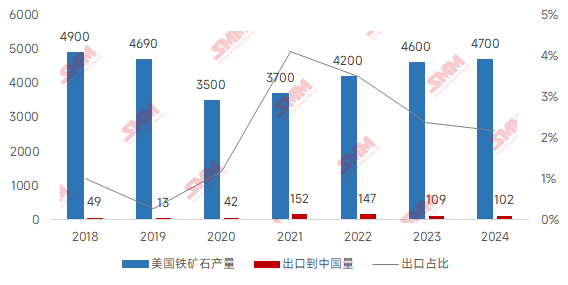
Data Source: U.S. Geological Survey (USGS) and Industry Associations, General Administration of Customs
Click to view the SMM Metal Industry Chain Database


