

85results found for 'logistics costs'
Sort by : |
- [SMM Flash] South African Chrome Ore Traders Sound Alarm Over Widening Local Price Disconnect with International Buyers
A growing gap between local prices and what international buyers are offering has become a mounting concern among South African chrome ore traders, with industry participants warning that the market is being skewed by pricing benchmarks that do not reflect the true cost structures of reliable, large-scale operations. Several traders have told SMM that international buyers are increasingly anchoring their offers to prices set by smaller traders operating low-cost wash plants. These smaller operations have significantly lower overheads and can afford to sell at levels that bear little resemblance to the actual production and logistics costs borne by larger, more established producers. Traders stress that international buyers are treating these low-end prices as market benchmarks without distinguishing between the vastly different value propositions offered by small-scale suppliers versus major operations backed by large, secure mines. Traders representing partnerships with big South African chrome ore mines point to key value-adds that justify a premium over low-cost wash-plant supply — value-adds they feel are being systematically overlooked. These include stronger quality assurances, greater resilience in supply continuity during adverse conditions, and the ability to sign firm contracts guaranteeing fixed volumes on consistent, agreed schedules such as weekly deliveries. Moisture content, a recurring buyer concern, was highlighted as an area where established operators can offer greater control and reliability — a point given added relevance by the severe winter weather that has recently hit South Africa, with a cold front and cut-off low pressure system bringing heavy snow, disruptive rain, strong winds and freezing temperatures across parts of the country. The broader concern among South African traders is that international buyers are not adequately factoring operations costs, operational stability, supply certainty, and quality assurance into their pricing decisions. With the gap between low-cost, smaller-scale supply and premium, large-scale production widening, traders are calling for greater market awareness of the cost realities and service levels that differentiate reliable, long-term partners from spot-market players offering bargain prices without the same commitments.
Aug 12, 2026 21:54 - Sudden Production Cuts at Brazil Alumina Refinery Impact Supply-Demand Balance; Outside China Alumina Gains Short-Term Support but Long-Term Loose Pattern Remains Unchanged [SMM Analysis]
SMM August 12: A sudden supply-side disruption has significantly altered the short-term supply-demand balance in the alumina market outside China. On August 11, Hydro’s Alunorte alumina refinery in Brazil was forced to activate emergency response measures due to a natural gas supply outage, cutting alumina production to 50% of capacity. The refinery has an existing capacity of 6.3 million mt/year, and after the 50% cut, the operating capacity fell to around 3.15 million mt/year, equivalent to a monthly production loss of approximately 250,000 mt—a non-negligible impact on the overall supply landscape outside China. Before this unexpected production cut, the alumina market outside China was in a slight surplus: in July, global alumina supply (excluding China) exceeded demand by about 486,000 mt, reflecting a loose supply-demand pattern. However, with Alunorte’s sharp output reduction, the August overseas surplus is expected to narrow quickly to around 177,000 mt. It is worth further noting that alumina prices outside China still lag behind domestic levels. This price spread means some alumina needs to be transshipped and repackaged in China before it can be exported, adding extra packaging and logistics costs. At the same time, China still maintains a net-import pattern for alumina, with monthly net imports averaging around 100,000 mt. Taken together, the actual surplus available for supply outside China will be further squeezed to merely about 70,000 mt. The supply-demand balance will abruptly shift from relatively loose to a tight balance, significantly elevating the risk of regional structural shortages, and alumina prices outside China are highly likely to find upward support in the short term. However, it must be objectively recognized that the price rally is not solely driven by Alunorte’s production cuts. Another structural support factor exists in overseas markets: due to strait passage issues, demand for bagged alumina in the Middle East is relatively urgent, while bulk alumina cannot effectively meet local supply because of transportation constraints. This situation has prompted some traders to first sell bulk alumina and then turn to purchase bagged alumina to fill the gap. Bagged alumina itself commands a notable premium—its FOB price is typically more than $20/mt higher than that of bulk alumina. This extra packaging and logistics cost has, to some extent, pushed up the overall price center in the regional market, serving as a secondary support for near-term alumina price strength outside China. Even if short-term sentiment and supply-demand fundamentals converge to drive prices higher, the upside room for alumina prices outside China may remain relatively limited. The core reason is that India still has plans to launch new capacity—a 1 million mt/year alumina project is expected to gradually advance its expansion in Q4 this year and Q1 next year, which will effectively supplement market supply at that time. Therefore, although supply was tight in Q3 due to production cuts at Alunorte, from a full-year perspective, the supply tightness in Q4 will ease noticeably, making it difficult to support a sustained sharp price increase. More attention should be paid to the uncertainty of disturbances on the time dimension. Currently, the duration of Alunorte’s natural gas supply issue remains unclear. If it is properly resolved in the short term, the impact of the production cuts will be relatively manageable; however, if the repair cycle is prolonged, the supply deficit outside China in Q3 will persist. Early signs of tight spot supply have already emerged in some regions. With the combination of fundamentals and sentiment, the likelihood of alumina prices outside China holding up well increases. Looking further ahead, new alumina capacity in Indonesia will be released gradually next year, and the global alumina supply landscape will evolve towards a looser balance, putting downward pressure on the long-term price center. In summary, the impact of this Alunorte production cut event on the alumina market outside China is mainly concentrated in Q3 this year. Short-term prices are expected to rise due to expectations of tightening supply-demand and regionally structural cost increases. However, constrained by the expectations of long-term growth from India’s new capacity about to be commissioned, as well as the continuous loosening pressure from capacity releases in Indonesia in Q4 this year and early next year, the current price rise reflects more of a periodic rebound rather than a trend reversal. It is expected that alumina prices outside China will consolidate on a strong note in Q3, and from Q4 to early next year, as new capacity comes online, the price center is likely to pull back gradually. (The above information is based on market data collection and comprehensive assessment by SMM’s research team. The information provided is for reference only. This article does not constitute direct investment advice. Clients should make prudent decisions and not use this as a substitute for independent judgment. Any decisions made by clients are not related to SMM.) Data source: SMM
Aug 12, 2026 15:12 - Lloyds Metals’ Q1 Earnings Surge as Pellet, DRI Expansion Accelerates Shift Toward Integrated Steelmaking
Lloyds Metals reported strong Q1 FY27 growth as iron ore production rose 53% y/y to 6.05 million tonnes, while the ramp-up of pellet and DRI capacity strengthened its shift toward integrated steelmaking and increased captive consumption of iron ore.
Aug 12, 2026 10:30 - CMR Green Technologies to Add Two New Recycling Plants in Tamil Nadu and Haryana in India
With this expansion, CMR expects its recycling capacity to exceed 700,000 tonnes per year by FY27.
Aug 11, 2026 11:24 - 【SMM Analysis】Flood Impact Fades! Manganese Sulfate Market Ends Short-lived Upward Trend
Sentiment in China’s battery-grade manganese sulfate market has gradually returned to rationality, as the flood-related factors that previously lifted prices in Guangxi continue to ease.In early July, continuous heavy rainfall and floods hit major production areas in Guangxi. Rising river levels and disrupted logistics forced multiple manganese sulfate producers to suspend operations for safety inspections and equipment maintenance, triggering a temporary shrinkage of available spot supply.
Jul 31, 2026 14:57  Nigerian Tantalum Concentrate Market: Pricing, Grades and Buyers
[SMM Research] Nigeria remains a key supplier of tantalum concentrate, with exports largely priced on an FOB basis and driven by strong Chinese demand. Concentrate grades vary widely, with higher Ta₂O₅ content commanding significant premiums. Artisanal mining dominates supply, while informal trade continues to limit market transparency. SMM's research indicates that first-hand market intelligence remains essential for assessing pricing, quality and evolving supply chains.
Jul 30, 2026 20:16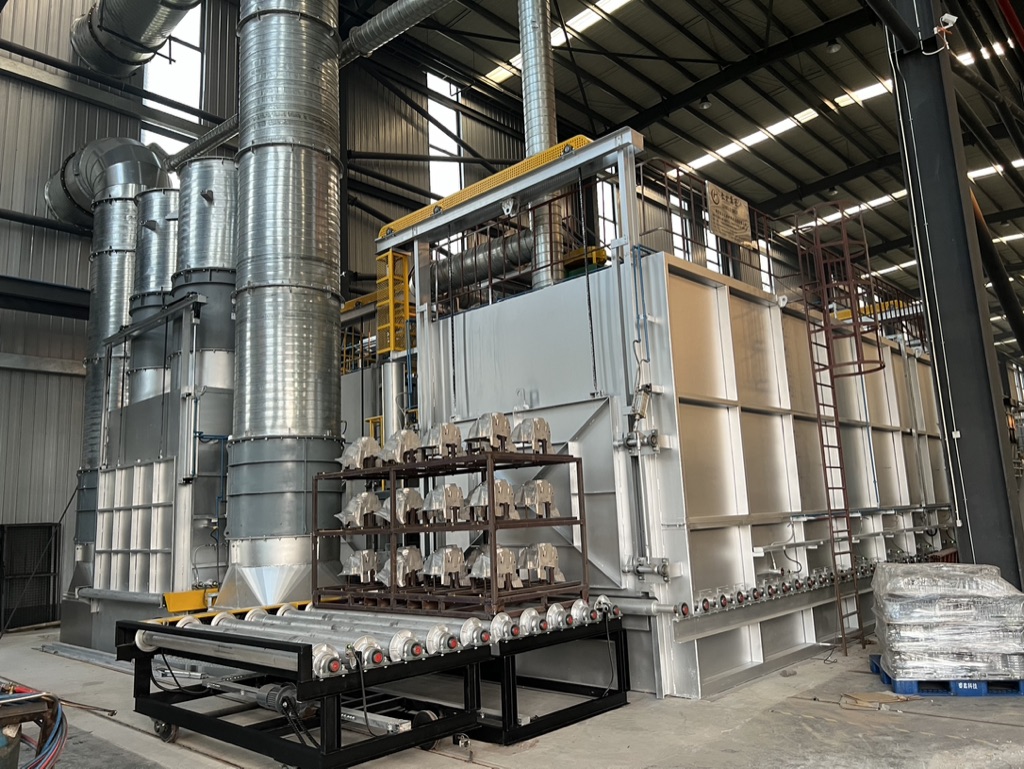 High Freight Rates & Vessel Shortages Continue to Weigh on Guinea Bauxite Shipments 【SMM Analysis】
Guinea-China bauxite freigh rates have rebounded recently amid renewed volatility in the Middle East and continued tightness in the dry bulk shipping market. As at least 70% of Guinea’s bauxite shipments are destined for China, sustained high freight rates on the Guinea-China route have not only lifted delivered logistics costs but also constrained shipments through weaker margins and limited vessel availability. Freight rose much faster than CIF prices, briefly accounting for over half of delivered prices SMM data showed that Guinea-China bauxite freight rates rose from $23.50/wmt on February 27 to $36.75/wmt on May 29, an increase of 56.4%. Freight remained at the same elevated level in the week ending June 5. Over the same period, the weekly average SMM Guinea bauxite CIF China price rose from $60.00/wmt to $68.00/wmt, an increase of only 13.3%, significantly lagging the rise in freight. As a result, freight as a share of the SMM Guinea bauxite CIF China price increased from 39.17% to 54.04%, meaning that ocean freight at one point represented more than half of the assessed delivered price. With CIF prices unable to fully absorb the additional shipping costs, pressure on miners’ and traders’ operating margins continued to build. According to SMM market contacts, the vast majority of surveyed Guinean mines reduced shipments to varying degrees after freight rates remained elevated, while some mines temporarily suspended loadings. High freight costs have therefore become a major direct factor behind the recent slowdown in Guinea’s bauxite shipments. In addition to prices, tight vessel availability has also restricted physical shipments. Traders and miners have widely reported difficulties securing spot bulk carriers, particularly for prompt cargoes. Some shipments have been delayed even where participants were prepared to accept prevailing freight levels, as vessels could not be secured in time and loading schedules had to be postponed. Peak season and contractual obligations initially supported March-April shipments Despite the sharp rise in Guinea-China freight rates from March, Guinea’s bauxite shipments remained relatively high during March and April. March-April is traditionally a peak shipment period in Guinea, when mining, inland transport and port-loading conditions are relatively favourable. In addition, previously signed long-term contracts and vessels booked in advance still had to be fulfilled. At the beginning of the freight rally, many market participants also expected the increase to be temporary. Miners therefore did not immediately make broad adjustments to existing shipment plans. SMM data showed that average weekly bauxite shipments from Guinea stood at 4.98 million mt between March 6 and April 24. Shipments remained high even after freight exceeded $30/wmt, reaching a weekly peak of 6.15 million mt in the week ending April 3. However, as elevated freight rates persisted into late April and May, the support from existing contracts, previously arranged vessels and the seasonal shipment peak gradually weakened. The impact of shipping costs became increasingly visible in outbound volumes. Average weekly shipments fell to 4.00 million mt between May 1 and June 26, down 19.8% from the March 6-April 24 average. Monthly data showed a similar trend. Guinea shipped 17.50 million mt in May, down 18.5% month on month, before shipments declined by another 10.0% to 15.74 million mt in June. The timing of the decline broadly coincided with the prolonged period of high freight rates and increasingly tight spot vessel availability reported by market participants since late April. Freight pressure eased briefly in late June before returning in July Shipping-market pressure eased temporarily in the second half of June as more positive expectations emerged around Middle East negotiations. Guinea-China bauxite freight rates fell from $36.75/wmt on June 5 to $31.00/wmt on July 3, while freight as a share of the SMM Guinea bauxite CIF China price declined from 54.04% to 43.66%. However, shipments did not recover immediately. Restarting cargo programmes, securing vessels and reorganising loading schedules all require time. Guinea was also moving deeper into its rainy season, further limiting the speed of any recovery. The rainy season generally runs from May to November, with the impact becoming more pronounced in July and August. SMM market feedback suggests that rainfall may reduce shipments by around 20% during the most disruptive period by affecting mine-to-port transportation, barge operations and loading efficiency. Entering July, renewed escalation in the Middle East pushed Guinea-China freight rates higher again. Freight rose from $31.00/wmt on July 3 to $35.00/wmt on July 24, an increase of 12.9%. Over the same period, the weekly average SMM Guinea bauxite CIF China price edged down from $71.00/wmt to $70.50/wmt, lifting the freight share back to 49.65%. According to SMM market contacts, as freight rates rebounded and spot bulk carriers remained difficult to secure, some mines that had previously planned to resume shipments again reduced or suspended loadings. Weekly shipments declined from 3.41 million mt in the week ending July 3 to 3.07 million mt in the week ending July 24, a decrease of 9.9%. Shipments fell as low as 2.83 million mt in the week ending July 17. As of July 24, Guinea’s cumulative July shipments stood at 10.55 million mt, equivalent to an average of 439,500 mt per day, down 16.2% from June’s daily average. SMM outlook SMM believes that the recent pressure on Guinea’s bauxite shipments cannot be attributed solely to seasonal rainfall. Persistently high freight rates and tight spot vessel availability have become the main direct constraints on shipments, while the rainy season has amplified the disruption. High freight rates continue to compress the operating room available to miners and traders, while scarce vessel availability is preventing some cargoes from progressing from planned sales to actual loading. The traditional shipment peak, contractual obligations and previously arranged vessels delayed the transmission of higher freight costs into shipment volumes during March and April. However, as elevated freight rates persisted, the vast majority of surveyed miners gradually reduced shipments, while some temporarily halted loadings, with the impact becoming increasingly apparent from May. In the near term, developments in the Middle East, fuel costs and dry bulk vessel availability in the West African market will remain key factors influencing Guinea-China freight rates. Should freight rates remain near $35/wmt or rise further, while tight spot bulk carrier availability shows no meaningful improvement, Guinean miners’ willingness to ship and their actual loading capacity may remain constrained. Combined with the impact of the July-August rainy season on mine-to-port transportation, barge operations and port-loading efficiency, Guinea’s weekly bauxite shipments are expected to remain volatile at relatively low levels, with marginal mines and spot cargoes facing greater pressure. Looking ahead to the third quarter of 2026, under SMM’s base-case scenario of persistently high freight rates, tight vessel availability and continued rainy-season disruption, Guinea’s bauxite shipments are expected to remain subdued and fluctuate at low levels. Average daily shipments may mainly range between 370,000 mt and 400,000 mt, corresponding to monthly shipments of approximately 11.5 million-12.0 million mt, broadly in line with the monthly average recorded in the third quarter of 2025. Shipments could stage a temporary recovery should Middle East tensions ease, freight rates decline significantly and bulk vessel availability improve. Meanwhile, developments concerning Guinea’s bauxite export quota policy remain a key uncertainty for the supply outlook. Any substantive implementation of related measures could further alter the pace of shipments and expectations for the country’s total bauxite exports.
Jul 30, 2026 18:56- Hydrogen Energy Policies in the 15th Five-Year Plan: From Pilot Demonstration to Large-Scale Commercialization
The newly released Renewable Energy Development Plan for the 15th Five-Year Period has accelerated the large-scale growth of China’s hydrogen energy industry. For the first time, hydrogen energy is officially incorporated into China’s non-fossil energy system, with a clear target of scaling renewable hydrogen production to 2 million tons annually by 2030. This milestone marks the end of the industry’s pilot phase and the start of a new commercial era focused on capacity expansion, quality improvement and viable energy substitution. The new policy targets key bottlenecks holding back green hydrogen adoption. While China has built one of the world’s largest hydrogen production capacities in recent years, the industry has yet to achieve economic viability. Green hydrogen remains costly to produce, with power expenses accounting for over 60% of total costs, making it uncompetitive against conventional grey hydrogen. Production bases are mostly concentrated in China’s Three-North regions, whereas industrial and transportation hydrogen demand is centered in coastal eastern China, leaving long-distance transportation and storage as a major operational hurdle. Most projects still rely on government subsidies and lack self-sustaining business models. Demand Expansion: Policy-Driven Market Offtake Guarantees Stable Demand The Plan is reshaping the hydrogen market by shifting policy support from passive subsidies to mandatory non-power consumption assessments and blending standards, creating guaranteed market demand for green hydrogen. Hard regulatory and market incentives are pushing high-carbon sectors — including ammonia co-firing in coal power, hydrogen metallurgy in steel manufacturing, and green methanol for shipping — to adopt clean alternatives, unlocking tens of millions of tons of new market demand for green ammonia and green methanol. Yu Zhuoping, professor at Tongji University and chair of the Expert Committee of the China Hydrogen Alliance, put forward a clear cost reduction roadmap for the 15th Five-Year period. The core goals include cutting green hydrogen production costs below 15 RMB per kilogram, lowering 100-kilometer transportation costs to 3–5 RMB per kilogram, and achieving cost parity between green hydrogen and traditional fuels for both transportation and industrial natural gas-based hydrogen use. This resolves the long-standing supply-demand deadlock constraining industry growth. Infrastructure Upgrade: Building Transportation Networks to Fix Regional Supply-Demand Mismatch The Plan prioritizes infrastructure improvement, shifting the industry’s focus from pure production capacity to efficient transportation and end-use application. China will build integrated green hydrogen, ammonia and methanol bases in Northeast China, the Yellow River Bend area, and remote desert and gobi regions. Wind-solar-hydrogen integrated development will generate scale effects to drive down costs for core equipment such as electrolyzers. Meanwhile, cross-regional hydrogen pipeline networks are under accelerated development, including the Ulanqab–Beijing-Tianjin-Hebei hydrogen pipeline and feasibility studies for dedicated green methanol pipelines. This new network will effectively connect resource-rich renewable energy bases with major consumption markets. Zheng Nanfeng, CAS academician and dean of the College of Energy at Xiamen University, noted that current hydrogen, ammonia and methanol projects still follow outdated chemical industry standards. Construction, installation and auxiliary facility costs are more than three times higher than core equipment costs, pushing up capital expenditures (CAPEX). Pipeline transportation can slash long-distance hydrogen logistics costs to around 3 RMB per kilogram per 1,000 kilometers, far more cost-effective than traditional tanker delivery. Value Enhancement: Securing Global Carbon Asset Pricing Power Beyond industrial upgrades, the Plan lays the groundwork for sustainable commercial operations and global carbon pricing influence. It supports Shanghai’s development into an international green fuel bunkering and trading hub, and promotes the establishment of unified green fuel sustainability certification systems. This allows China’s green hydrogen industry to shift from simply selling raw energy products to exporting certified low-carbon energy with verifiable carbon footprints. Amid global carbon trade barriers such as the EU CBAM, enterprises that master international carbon certification and carbon credit monetization will capture premium benefits from global decarbonization trends. The next five years will bring unprecedented certainty to China’s hydrogen market. Industry profits will gradually polarize: leading players with core material R&D capabilities, carbon asset pricing advantages and integrated operational resources will dominate high-margin sectors. Enterprises with low-end, redundant production capacity, no stable low-cost green power supply and no fixed end-use scenarios will be phased out. Only full-industry-chain operators will seize the massive growth dividends of China’s trillion-yuan hydrogen energy market.
Jul 30, 2026 17:01 - Chengtun Mining: H1 Net Profit Up 71.37% YoY, Copper-Cobalt Segment in DRC Achieves Stable Output
On July 30, Chengtun Mining’s share price declined. As of 13:22 on the 30th, Chengtun Mining was down 5.03% at 10.2 yuan per share. On the news front: Chengtun Mining’s 2026 semi-annual report released on July 30 showed that in H1 2026, the company achieved total operating revenue of 19.264 billion yuan, up 39.56% YoY; net profit attributable to shareholders of 1.804 billion yuan, up 71.37% YoY; and net profit after deducting non-recurring items of 1.913 billion yuan, up 64.63% YoY. Regarding its core business, Chengtun Mining stated in its semi-annual report that the company was committed to the development and utilization of energy metal resources, especially metal varieties required for new energy batteries, while also expanding into precious metals such as gold. The company focused primarily on copper, nickel, cobalt, and gold, with its main business types being energy metals, base metals, metal trading, and others. Chengtun Mining’s semi-annual report showed that in H1 2026, the company’s DRC copper-cobalt segment delivered stable output, with copper production reaching 132,200 mt in metal content, of which Brother Mining (BMS) achieved copper production of 74,400 mt in metal content. BMS’s specialized energy management system took shape. The Kalongwe project advanced in a coordinated manner in optimizing the production system and engineering construction; multiple technological transformation initiatives reduced material consumption, and optimized reuse of return water lowered energy consumption and enabled refined cost control. The copper-cobalt smelting projects CCR and CCM maintained stable production and operations. The company also carried out exploration in prospective areas and extension-style resource M&A to strengthen the foundation for sustainable development. In the Indonesia nickel segment, Youshan Nickel maintained stable production and operations amid global nickel market price consolidation, achieving operating revenue of 1.663 billion yuan; by improving management, optimizing processes, and strengthening industry-chain synergies, it successfully withstood market shocks. Phase I capacity of the Guizhou project was gradually released, process flows became increasingly mature, and product quality improved steadily; Phase II of the project carried out trial production. Huajin Mining operated steadily, achieving gold sales of 156.31 kg and operating revenue of 145 million yuan. During the reporting period, operating revenue from production and manufacturing was 18.756 billion yuan, accounting for 97.36% of the company’s total revenue, up 2.92 percentage points YoY, and it continued to maintain high-quality operations. Regarding the status of its core businesses, Chengtun Mining’s semi-annual report showed: 1. Energy Metals Business. During the reporting period, the company’s energy metals business achieved revenue of 14.543 billion yuan, with a gross margin of 27.03%, basically in line with the gross margin in the same period last year. In H1 2026, output of copper products was 133,200 mt in metal content, cobalt products 3,700 mt in metal content, and nickel products 21,200 mt in metal content. ( 1) Copper-Cobalt Segment ① During the reporting period, the company’s DRC copper-cobalt segment delivered stable output, with copper production reaching 132,200 mt in metal content, of which Brother Mining achieved 74,400 mt in metal content. The company addressed power shortage issues through a multi-type energy mix, building a modern energy system that is specialized, intensive, and integrated, driving synchronized growth in operating efficiency and scale effects. ② Dali Sanxin actively advanced mine construction and aimed to achieve trial production in Q4. At present, land and other related procedures had been completed, shaft construction was basically completed, and surface civil works construction was being actively advanced. ③ In April 2026, the company disclosed that it planned to acquire a 50% equity interest in Nkoyi Leopard Mining and Investment Limited to indirectly obtain a 30% interest in a large, specific copper-cobalt mining right. The project completed the equity closing in July 2026, and subsequent cooperation matters regarding the mine were progressing normally. During the reporting period, the company actively sought resource security for sustainable development through exploration in prospective areas and by pursuing extension-style M&A and cooperation for copper ore resources. (2) Indonesia Nickel Segment During the reporting period, the global nickel market fluctuated amid the interplay of Indonesia policy adjustments and rising cost side pressures. Youshan Nickel maintained stable production and operations, achieving operating revenue of 1.663 billion yuan and demonstrating strong operating resilience. (3) Deep Processing and Materials Segment ① During the reporting period, Keli Xin’s operating revenue increased by 25.6% from the same period last year, with rapid growth in operating performance. Meanwhile, the company continued to expand its product lines and enrich product models to meet different battery systems’ requirements for high voltage and high safety, effectively improving client response speed and product compatibility. ② Zhonghe Nickel optimized process technologies, further advanced refined on-site production management, improved recovery rates of valuable metals, and enhanced the production system’s adaptability to multi-channel raw material sources. ③ Phase I capacity of the Guizhou project was gradually released, process flows became increasingly mature, and through various refined control measures, it ensured continuous and stable production operations, with product quality improving steadily. Phase II of the Guizhou project smoothly entered trial production. 2. Base Metals Business. During the reporting period, the base metals business achieved sales revenue of 4.213 billion yuan, with a gross margin of 9.50%, up 5.61 percentage points from the same period last year. (1) During the reporting period, Chengtun Zinc & Germanium operated steadily, with notable results in comprehensive recovery; indium and germanium recovery rates both improved. Technical breakthroughs achieved cost reductions in auxiliary material and a record high in silver recovery indicators; multi-dimensional cost reduction and efficiency enhancement significantly lowered logistics and inventory expenses, and overall production operations remained stable. (2) During the reporting period, the company actively advanced the orderly construction of domestic and overseas mines. Construction of the Baoshan Hengyuan Xinmao mining engineering project progressed steadily; Huajin Mining operated steadily, selling 156.31 kg of gold and achieving revenue of 145 million yuan. 3. Metal Trading Business and Others. During the reporting period, the metal trading business achieved operating revenue of 307 million yuan. At present, the scale of the company’s core businesses continued to grow steadily, the proportion of the trading business gradually declined, and the business structure continued to be optimized, achieving solid results on the path of high-quality development. In addition, Chengtun Mining announced on July 23 that the cumulative deviation in the increase of its stock’s closing price exceeded 20% over three consecutive trading days on July 21, July 22, and July 23, 2026, constituting abnormal fluctuations in stock trading. After verification, the company found no media reports or market rumors that needed clarification or response, and found no other material events that could have a significant impact on the company’s share price. As of the date of this announcement, other than information publicly disclosed by the company in designated media, there was no other material information that should have been disclosed but had not been disclosed, including but not limited to planning major asset restructurings involving publicly listed firms, share issuances, major transactions, business restructurings, share repurchases, equity incentives, bankruptcy reorganizations, major business cooperation, introduction of strategic investors, and other major matters. The company’s current operating conditions were normal, and there had been no material changes in the internal and external operating environment. Chengtun Mining announced on July 9 that the transaction in which its wholly owned great-grand subsidiary Preeminence Holdings Limited (Preeminence) acquired a 50% equity interest in Nkoyi Leopard Mining and Investment Limited (Nkoyi) had made new progress. As of the date of this announcement, Nkoyi had completed the change of its shareholder register, and all registration and filing procedures for changes involving directors and senior management in this transaction had been completed. Preeminence had now obtained a 50% equity interest in Nkoyi, and the company had, in accordance with the Share Purchase Agreement under the transaction, paid the equity acquisition consideration to the target company. In Huafu Securities’ nonferrous metals weekly report released on July 26, its commentary on industrial metals mentioned: Industrial metals: tight inventory coupled with geopolitical tailwinds lifted copper prices strongly. From a macro perspective, the Middle East US-Iran geopolitical conflict continued to recur. Multiple parties mediated to advance ceasefire talks, but differences between the two sides were difficult to bridge quickly, and the market continued to trade the potential risk of disrupted shipping through the Strait of Hormuz. Once passage through the waterway is restricted, it would not only push up international crude oil prices and raise global smelting and logistics costs, but also affect outbound shipments of Middle Eastern sulfur, directly disrupting the supply of raw materials for ex-China hydrometallurgical copper production, continuously injecting a geopolitical risk premium into copper prices; repeated changes in news flow also amplified intraday fluctuations in LME copper. This week, tensions in the US-Iran Strait of Hormuz situation remained elevated, and shipping risks in the strait continued to affect market sentiment. Individual stocks: Copper—watch JCC, CMOC, Chengtun, Zangge, JCHX, and Beitong; for H-shares, watch NFC and Minmetals, among others. Aluminum—watch Tianshan, Hongchuang, Yunnan Aluminum, Shenhuo, Huatong, Hongqiao, and Zhongfu, among others. Citigroup recently published a report stating that it held a constructive view on the copper market over the coming weeks, maintaining its expectations unchanged for a 0–3 month short-term copper price target of $14,500 per mt and a year-end target of $15,000 per mt. Citigroup noted that over the past month, despite a pullback in speculative long positions and overall weakness in commodities, copper prices remained resilient. While demand growth remained weak, the supply side faced greater pressure. Global mine supply remained under pressure, while year-to-date scrap supply appeared to respond weakly to high prices. Chilean mine supply risks and sulfur supply constraints could, at the margin, lift market sentiment. A CITIC Securities research report said that multiple positive factors drove copper prices to again challenge $14,000, and that core drivers such as declining inventory and supply disruptions were expected to persist; most potential tariff paths remained positive for copper, and under a neutral assumption, copper prices were expected to challenge $15,000 within the year. The copper sector was still at the beginning of a valuation recovery, and the formation of expectations for price hike and improvements in market sentiment would continue to drive valuation recovery.
Jul 30, 2026 13:46 - What Is Liontown Signalling About Lithium Supply? 【SMM Analysis】
On 29 July, Australian lithium producer Liontown released its quarterly report for the period ended 30 June 2026. The Kathleen Valley lithium project produced 103.1 kdmt of spodumene concentrate during the June quarter, up 7% QoQ, while sales increased 29.3% QoQ to 108.5 kdmt. Average shipped grade was 5.0% Li₂O, while the average realised price was US$1,880/dmt on an SC6e, CIF basis. For FY26, Kathleen Valley produced 392.0 kdmt of spodumene concentrate, within the company’s previous guidance range of 365–450 kdmt. Liontown issued a clarification on the same day to amend the units of reference used in its FY26 results and FY27 guidance, removing the previous references to SC6 from concentrate production and cost metrics. Accordingly, concentrate production is reported on an actual dry metric tonne basis, unit operating costs are calculated per dry metric tonne sold, while average realised prices continue to be reported on an SC6-equivalent basis. Kathleen Valley has gradually moved beyond the initial question of whether it can achieve stable production and is now entering the underground mining ramp-up phase. More importantly for the lithium market, however, the key signal from this quarter is not the amount of additional concentrate Liontown will produce in FY27. Rather, the previous recovery in lithium prices has strengthened Liontown’s cash flow and balance sheet sufficiently to support renewed investment in underground development and expansion. Supply elasticity is therefore showing up first in capital expenditure rather than in near-term tonnes. US$1,880/dmt Marks a Quarterly High for Liontown, but Remains Below the 2026 Market Average Liontown achieved an average realised price of US$1,880/dmt on an SC6e, CIF basis during the June quarter, only 1.9% higher than US$1,845/dmt in the previous quarter. From Liontown’s own pricing history, this represented the highest quarterly realised price in FY26. Kathleen Valley’s average realised prices across the four quarters of FY26 were US$691/dmt, US$985/dmt, US$1,845/dmt and US$1,880/dmt, respectively, with a full-year average of US$1,379/dmt. However, viewed against the broader spodumene market in 2026, US$1,880/dmt is not particularly high. Compared with SMM’s year-to-date average for SC6 CIF China, Liontown’s realised price during the quarter remained at a discount to the broader market average. This suggests that Liontown has not fully captured the magnitude of the increase previously seen in spot spodumene prices. Table 1. Kathleen Valley FY26 Production, Sales and Pricing Metric Q1 FY26 Q2 FY26 Q3 FY26 Q4 FY26 Spodumene concentrate production (dmt) 87,172 105,342 96,367 103,111 Spodumene concentrate sales (dmt) 77,474 112,122 83,912 108,489 Average shipped grade 5.00% 5.10% 5.10% 5.00% Average realised price (US$/dmt, SC6e) 691 985 1,845 1,880 Source: Liontown. One important explanation lies in the pricing mechanism of Liontown’s offtake agreements. The company stated that customer receipts during the quarter benefited from stronger lithium indices and offtake agreements with lagged quotation periods, meaning that some contract prices are determined using benchmark prices from earlier periods. Liontown’s realised price therefore does not immediately track the contemporaneous spot market. Instead, benchmark prices are transmitted into realised prices with a time lag through contractual pricing formulas. During a rising market, this mechanism can leave realised prices below spot prices. Conversely, when spot prices fall, the same lag can temporarily support realised prices above prevailing market levels. For earnings analysis, US$1,880/dmt should therefore not simply be interpreted as Liontown’s current market selling price. The more relevant indicator is the evolution of Liontown’s realised-price discount or premium relative to the SMM SC6 CIF China benchmark. In other words, Liontown generated the current improvement in cash flow even though its realised price remained below the 2026 market average. This suggests that Kathleen Valley has already developed relatively strong cash-generation capability under the current pricing environment. Prices Have Moved Through the Income Statement and Are Now Feeding into Capex Liontown generated A$235 million in revenue during the June quarter, with operating cash flow reaching A$180 million. Net cash increased by A$137 million during the quarter, taking the company’s cash balance from A$424 million at the end of March to A$561 million at the end of June. At the end of FY25, Liontown held only A$156 million in cash. Its cash balance has therefore increased by more than threefold over FY26. Management has also explicitly changed the language around capital allocation. Six months ago, the company’s capital discipline was primarily focused on strengthening the balance sheet. It has now shifted towards pursuing value-accretive growth. This represents the key capital-cycle signal in the quarterly report: Higher lithium prices → improved realised prices → stronger cash flow → balance-sheet repair → renewed underground development and expansion capex. Liontown has now moved into the latter part of this transmission chain. FY27 Production Increases by Only ~23 kt, While Capex Rises to Nearly Three Times FY26 Levels Based on Liontown’s clarified reporting basis, the company produced 392 kdmt of spodumene concentrate in FY26, with FOB unit operating costs of A$987/dmt sold, AISC of A$1,233/dmt, and total capital expenditure of A$114 million. For FY27, Liontown is guiding to spodumene concentrate production of 390–440 kdmt, FOB unit operating costs of A$1,050–1,250/dmt sold, and total capital expenditure of A$320–370 million. Table 2. Liontown FY26 Actuals vs FY27 Guidance Metric FY26 Actual FY27 Guidance Change at Midpoint Spodumene concentrate production (kdmt) 392 390–440 0.059 FOB unit operating cost (A$/dmt sold) 987 1,050–1,250 0.165 AISC (A$/dmt) 1,233 — — Total capital expenditure (A$m) 114 320–370 ~+203% Source: Liontown clarification dated 29 July. At the midpoint of FY27 production guidance, Kathleen Valley would produce approximately 415 kdmt, only around 23 kdmt more than FY26, representing growth of roughly 5.9%. By contrast, the midpoint of FY27 capex guidance is A$345 million, approximately three times FY26 expenditure. FY27 should therefore not simply be characterised as a year of production growth. A more accurate interpretation is: FY27 is a transition year in which production growth remains limited while substantial capital is deployed ahead of future capacity growth. This also illustrates the time lag between the recovery in lithium prices and the eventual supply response. Investment is responding first; additional physical tonnes will follow later. Why Are Unit Costs Rising from A$987/dmt to A$1,050–1,250/dmt? The increase in FY27 cost guidance is another important variable in the report. FY26 FOB unit operating costs averaged A$987/dmt sold, while FY27 guidance rises to A$1,050–1,250/dmt sold. At the midpoint of A$1,150/dmt, this represents an increase of approximately 16.5%. This should not automatically be interpreted as evidence that underground mining is structurally more expensive. Liontown has not provided a quantitative breakdown of the factors driving the FY27 unit-cost increase, but the report identifies several relevant factors. First, logistics costs have increased. June-quarter unit operating costs rose from A$981/dmt sold to A$995/dmt sold, with Liontown attributing the increase primarily to higher diesel prices resulting from conflict in the Middle East, which increased transportation costs. Second, underground mine development expenditure is increasing. Q4 FY26 AISC rose from A$1,251/dmt sold to A$1,314/dmt sold, mainly because underground mine development costs began to be recognised as sustaining capital following the declaration of commercial production. Third, FY27 production guidance incorporates both scheduled maintenance and additional downtime required to connect expansion infrastructure with the existing processing system. This downtime has an important secondary effect: even if absolute fixed costs remain unchanged, lower saleable volumes mechanically increase costs on an A$/dmt sold basis. The increase in FY27 costs therefore appears to reflect a combination of: higher energy and logistics costs + increased underground development expenditure + fixed-cost dilution associated with planned downtime. These drivers have different degrees of persistence. If underground operations stabilise, recoveries improve and expansion-related downtime declines, some of the FY27 cost pressure could unwind. However, if underground mining itself carries materially higher unit mining costs, Kathleen Valley’s long-term cost base could shift structurally higher. Further FY27 operating data will be required to distinguish between these two outcomes. At this stage, there is insufficient evidence to treat the A$1,050–1,250/dmt FY27 range as Kathleen Valley’s new long-term normalised cost level. Underground Ore Mined Falls 12%, While Development Metres Rise 35% Kathleen Valley’s mining data also display characteristics typical of an underground mine in ramp-up. Underground ore mined during the June quarter fell 12% QoQ to 356 kt. However, underground development increased 35% QoQ to a record 3,316 metres. This suggests that Liontown is not simply maximising near-term ore extraction. Instead, it is developing additional underground headings and mining areas to support higher future mining rates. The company plans to maintain an underground mining run rate of approximately 1.5 Mtpa in Q1 FY27, before beginning the next stage of the ramp-up in Q2 FY27, with a target of reaching a 2.8 Mtpa annualised mining run rate by the end of FY27. Processing recovery represents a second potential source of production growth. Kathleen Valley processed 647 kt of ore during the June quarter at an average feed grade of 1.3% Li₂O, while lithium recovery improved from 61% to 63%. Underground ore accounted for 55% of plant feed. Liontown stated that when the plant processes sustained campaigns of cleaner underground ore, lithium recoveries can consistently reach approximately 70%. Future concentrate production therefore depends on two separate variables: Mining rate determines how much ore is available; recovery determines how much concentrate can be produced from that ore. If underground mining rates and plant recoveries improve simultaneously, Kathleen Valley could benefit from both higher ore availability and better conversion into concentrate. Conversely, even if the 2.8 Mtpa annualised mining-rate target is achieved, sustained recovery of only around 63% would result in lower concentrate production than the theoretical mining capacity might otherwise imply. FY27 Guidance Should Not Be Treated as 100% Certain Supply For a project still ramping up underground operations, company guidance should not be treated as guaranteed supply. Based on Kathleen Valley’s current operating position, SMM applies the following scenario framework to FY27 concentrate production: Table 3. Kathleen Valley FY27 Production Scenarios Scenario Key Assumptions FY27 Concentrate Production Probability Bull Underground development progresses to plan; recovery approaches 68–70%; limited impact from planned downtime 430–440 kdmt 20% Base Underground ramp-up broadly on schedule; 2.8 Mtpa run rate reached mainly toward FY27-end; recovery at 63–66% 400–420 kdmt 60% Bear Development, equipment utilisation or recovery underperforms; downtime exceeds expectations 370–390 kdmt 20% The 20%/60%/20% probabilities represent SMM’s analytical risk-weighting assumptions based on the project’s current stage, rather than Liontown guidance or statistically derived historical probabilities. Under this framework, probability-weighted FY27 concentrate production would be approximately 410 kdmt, slightly below the 415 kdmt midpoint of company guidance. These probabilities can be updated as Liontown reports Q1 FY27 underground development, ore mined, recovery rates and actual downtime. FY27 Underground Ramp-Up and the Expansion FID Need to Be Analysed Separately One important distinction is that Liontown’s FY27 production guidance of 390–440 kdmt does not represent post-expansion production. The company has explicitly stated that its FY27 guidance assumes no final investment decision has yet been made on the Kathleen Valley Expansion. The current A$320–370 million capex guidance includes the remaining early works announced in April, but excludes additional expansion capital expenditure that would follow a positive FID. The two sources of future supply therefore require different risk adjustments: FY27: discount for underground ramp-up and operational execution risk. FY28 onward: apply additional discounts for FID, capital requirements, construction schedule, plant integration and ramp-up risk. Liontown has already commenced early works and long-lead procurement ahead of the formal FID, including the purchase of a 5.5 MW ball mill designed to increase processing capacity and improve grinding control and recovery. A formal FID is expected by the end of Q1 FY27. The expansion has therefore moved beyond the stage of being merely an announced project. However, this does not mean that the expansion’s full incremental capacity should automatically be included in the FY28 supply balance. FID does not equal on-time commissioning, and on-time commissioning does not equal immediate achievement of nameplate capacity. Kathleen Valley’s ~23 kt FY27 Increment Is Small in the Context of Australian Spodumene Supply At the midpoint of guidance, Kathleen Valley would add only around 23 kt of spodumene concentrate in FY27 compared with FY26. Using standard industry SC6 conversion assumptions, this represents only several thousand tonnes of LCE, making it a marginal addition to a global lithium market measured in millions of tonnes of LCE. The scale becomes clearer when compared with other established Australian assets. Following completion of P1000, PLS’s Pilgangoora operation has reached nominal spodumene concentrate capacity of approximately 1 Mtpa. PLS has also approved the restart of the approximately 200 ktpa Ngungaju processing plant in 2026. Meanwhile, Wesfarmers and SQM have recently approved A$1.45 billion of investment to expand Mt Holland, targeting an increase in spodumene concentrate capacity from approximately 380 ktpa to 760 ktpa, although first incremental production is not expected until around 2030. Liontown’s quarterly report therefore does not materially change the FY27 global spodumene supply balance. Its broader significance lies elsewhere: Kathleen Valley provides a clear example of how improving lithium economics are beginning to reactivate capital expenditure across established Australian assets. What the market is currently seeing is therefore a leading indicator of future supply elasticity, rather than the supply itself. SMM View: Liontown Is Signalling That Capital Is Returning Before Supply Does Liontown’s quarterly report has limited direct implications for the near-term spodumene supply-demand balance. The midpoint of FY27 concentrate production guidance is only around 23 kt above FY26 actual production. Even if fully achieved, this would not represent a material addition to global lithium supply. The more significant change is in capital deployment. Liontown ended FY26 with A$561 million of cash, while FY27 capital expenditure guidance has increased from A$114 million in FY26 to A$320–370 million. The company is increasing underground development, procuring expansion equipment ahead of FID and targeting an Expansion FID around the end of September. Kathleen Valley therefore illustrates a four-stage supply response: Higher prices → stronger cash flow → capex recovery → incremental production. Liontown is currently moving from the second stage into the third. The quarterly report therefore cannot be reduced to a simple narrative of “higher lithium prices → Liontown increases production → supply pressure rises.” The actual FY27 volume increase is limited, while the supply associated with today’s capital expenditure will predominantly emerge from FY28 onward. For the global lithium market, the more important question is whether the same pattern is beginning to emerge simultaneously across high-quality Australian brownfield assets. Pilgangoora has completed P1000 and is restarting Ngungaju; Mt Holland has approved A$1.45 billion of expansion investment; and other Australian assets, including Mt Marion, are also seeing renewed capital deployment. If improving lithium economics continue to reactivate expansion spending across existing mines, medium-term supply elasticity could prove materially greater than suggested by looking only at incremental production over the next 12 months. For Liontown itself, the next event that matters more than another ordinary quarterly production number will be the Kathleen Valley Expansion FID expected around the end of September. At that point, the key variables for the supply model will not simply be whether the project is expanded, but the targeted capacity, capital intensity, construction schedule and ramp-up timeline. Those four variables will ultimately determine when the capital being deployed today becomes physical spodumene concentrate entering the market. SMM New Energy Analyst Lesley Yang yangle@smm.cn
Jul 30, 2026 08:40