8results found for 'Platts'
Sort by : |
- 【SMM Insights】Global Iron Ore Market Landscape Undergoes Unprecedented Reshaping - Africa's Role as Key Player
Over the past half-century of industrialisation, the global seaborne iron ore market consolidated around a duopoly dominated by Australia's Pilbara region and Brazil's Carajás and Iron Quadrangle districts. However, driven by macroeconomic cycle evolution, a structural shift in China's growth engine, and the steel industry's irreversible push toward low-carbon and green transformation, this traditional supply map is undergoing an unprecedented reshaping. On 26 November 2025, the first commercial vessel loaded with Simandou iron ore departed from the Port of Mabarya, marking the official commissioning of Guinea's Simandou Iron Ore Project — the world's largest undeveloped high-grade greenfield iron ore deposit by reserve. This milestone signals that the African continent, long relegated to secondary status, is progressively emerging as a significant new force in the global ferrous metals market. Africa's iron ore resources are widely regarded as the third-largest iron ore supply region globally, after Brazil's Carajás and Australia's Pilbara. With an estimated 13.8% share of global iron ore resources, and representing the most significant supply-side growth driver over the next five years, shifts in African iron ore dynamics will be a key determinant of international iron ore pricing over the long term. I. Global Iron Ore Market Background According to SMM research data, global iron ore production in 2025 is estimated at approximately 2.472 billion tonnes (bt). Africa contributes roughly 95 million tonnes (Mt), representing close to 4% of global output. As major mining projects progressively come on stream, Africa's iron ore production capacity is forecast to double by 2030, reaching approximately 259 Mt. Assuming no production curtailments elsewhere, Africa's global market share could rise to nearly 10%, while the overall global iron ore supply surplus is projected to widen to approximately 220 Mt. Although the international iron ore market has already entered a prolonged loose supply cycle, the substantive supply shock from African iron ore is expected to materialise gradually over the next five years. In the near term, Africa's estimated incremental shipment of approximately 15 Mt in 2026 — bolstered by its superior high-grade characteristics — is expected to be absorbed relatively smoothly by steelmakers seeking low-carbon blending feedstocks, resulting in a relatively moderate impact on absolute benchmark pricing. The critical inflection point is projected to fall in 2028–2029. As rail and port infrastructure currently under construction in West Africa is fully commissioned, a surge in high-grade iron ore output will exert heavy downward pressure on the right-hand side of the global iron ore cost curve. This will not only systematically compress the iron ore price floor but will trigger intense structural displacement — squeezing the operating margin of low-grade, high-cost producers. The current price downcycle is expected to persist through 2028. When international ore prices breach the USD 90/tonne marginal cost support level, higher-cost non-mainstream small and mid-size mines will be forced into curtailment and exit. The resulting supply shakeout will reshape the global iron ore supply structure into a multi-oligopoly dominated by ultra-large, low-cost operations (including the new African mines), complemented by quality mid-tier producers. II. Africa's Current Market Landscape: South Africa as Dominant Producer, West Africa Expanding Aggressively Building on the global context, this section focuses on Africa's overall iron ore landscape. As the primary driver of supply growth over the next five years, Africa's iron ore production is concentrated in West Africa and South Africa, currently dominated by three key countries. South Africa South Africa is the continent's largest producer, with 2025 output reaching approximately 67 Mt and export shipments maintaining an overwhelming 65% share of total African iron ore exports. However, South Africa's iron ore sector faces structural constraints limiting its organic growth headroom. As other emerging African resource nations commission significant new projects, South Africa's share of total African export volumes is projected to face sustained compression. Mauritania Mauritania is Africa's second-largest iron ore producer, with 2025 output of 15 Mt and export volumes of approximately 12 Mt, representing approximately 12% of the African market. Strategically situated adjacent to the Atlantic Ocean with high-grade iron ore deposits deep within the Sahara Desert, Mauritania possesses highly advantageous geographic and mineralogical characteristics. Its proximity to European and Middle Eastern markets — both in urgent need of green industrial raw materials — provides ideal conditions for the country to become a hub for global green metallurgy capacity relocation. Mauritania is expected to emerge as a highly promising iron ore supply nation going forward. Sierra Leone Sierra Leone is another important regional supply pole, with projected 2025 output also reaching approximately 12 Mt, holding a stable share of approximately 12% in the African export market. Chinese-invested iron ore mines within the country are actively scaling up their operations. Trade Flow Overview Based on full-year 2024 trade data, the proportion of African iron ore shipped to China is relatively low compared to traditional mainstream ore origins, at approximately 60%. The broader Pan-Asian market — encompassing China, Japan, and South Korea — absorbs approximately 70% of total African iron ore shipments. Western European countries, led by the Netherlands and Germany, constitute Africa's core secondary destination, accounting for close to 14% of trade flows. The remaining marginal trade flows are broadly diversified, extending to emerging steelmaking capacity clusters in the Middle East, including Bahrain, Oman, and Saudi Arabia. Key Corporate Players At the corporate level, South Africa's Kumba Iron Ore and Assmang rank as Africa's largest and second-largest iron ore producers, with annual output of approximately 37 Mt and 17 Mt respectively. Kumba Iron Ore: Kumba's mining operations — including the Sishen mine — are globally recognised for producing high-grade fines (Fe >62%) and metallurgically superior premium lump ore (Fe 65.2%). Under the prevailing trend of blast furnace (BF) emission reduction, this type of direct-charge lump ore — which reduces sintering-related carbon emissions — commands strong market demand and a substantial price premium. Assmang: Assmang similarly holds high-quality iron ore assets, operated as a 50:50 joint venture between African Rainbow Minerals (ARM) and Assore. Its Assmang Fines and Assmang Lump products (Fe 64–65%) are also direct-charge, high-quality materials. However, the company's key bottleneck lies not at the pithead but on the rail. Heavy dependence on Transnet Freight Rail (TFR) for haulage means logistics constraints frequently cap its achievable shipment volumes. SNIM (Société Nationale Industrielle et Minière): Mauritania's state-owned mining company is Africa's third-largest iron ore producer after the two South African majors. Unlike mainstream Australian and Brazilian ores, SNIM products occupy a distinctive niche in terms of physicochemical specifications and market segment. Its most widely traded product, TZFC fines, is characterised by extremely low alumina (Al2O3) and phosphorus (P) content. As an excellent blending ore, major steelmakers regularly blend SNIM fines with high-alumina Australian fines (such as certain Pilbara blend products) to significantly dilute the impurity ratio in the burden, thereby optimising blast furnace performance metrics. III. Africa's Market Transformation: Major Producers Facing Stagnation; Emerging Projects as Primary Growth Drivers Where does future growth lie? According to SMM observations, Africa is expected to undergo a significant structural transformation within the next five years. Multiple large-scale iron ore projects across the continent are currently under construction, with scheduled commissioning prior to 2030. Based on our modelling, African iron ore supply is forecast to grow substantially from the current approximately 95 Mt to 260 Mt over five years — a cumulative increase of 85%. The market structure is also expected to shift from South Africa-dominated Western-oriented exports to a Guinea-led export paradigm. Guinea — Simandou Iron Ore Project The primary growth driver will be Guinea's renowned Simandou iron ore project, jointly developed by multiple entities and representing the world's largest undeveloped high-grade open-pit hematite deposit. The project holds reserves in excess of 5 billion tonnes (bt) and a designed production capacity of 120 Mt per annum, making it the project with the greatest strategic potential to reshape the existing iron ore market structure. Since first ore shipments in late November 2025, cumulative exports from the principal export hub — the Port of Mabarya — reached approximately 1.6 Mt through Q1 2026. Blocks 1 & 2, developed under the Winning Consortium Simandou (WCS), have successfully commenced production, with 2026 capacity expected to reach nameplate and ramp-up to 60 Mt per annum projected over the next two to three years. Blocks 3 & 4, led by Simfer (a Rio Tinto and Baowu joint venture), are forecast to commission in Q1 2026, with estimated 2026 shipments of 5 Mt and a 30-month ramp-up timeline to reach 60 Mt per annum. In aggregate, Guinea is projected to achieve 120 Mt per annum before 2030, becoming the world's second-largest single iron ore project by capacity — second only to Vale's S11D project in Brazil (designed capacity of 200 Mt post-expansion, expected by 2030). Other African Countries — Key Development Projects Other nations — including Liberia, Gabon, Sierra Leone, and the Republic of Congo — all have iron ore projects under development. Projects scheduled for commissioning before 2030 account for a combined planned capacity of approximately 46 Mt. The largest single project is ArcelorMittal Liberia's (AML) Tokadeh Phase II, expected to commission in H2 2026 and reach a nameplate capacity of 20 Mt per annum by year-end, producing iron ore concentrate with an estimated grade exceeding Fe 66%. Given that AML's European steelmaking capacity cannot absorb such a large volume increment in the near term, the majority of Tokadeh's output is expected to enter the international seaborne market, exerting pricing pressure on the iron ore concentrate segment. South Africa — Structural Constraints on Production Growth South Africa's output is expected to remain broadly stable in the 63–67 Mt range, with mild downside risk. The primary underlying cause is the country's heavy dependence on the heavy-haul Sishen–Saldanha Bay rail corridor, operated by Transnet Freight Rail (TFR). In recent years, TFR has suffered a severe reduction in effective haulage capacity due to locomotive fleet shortages, frequent cable theft incidents, and chronic infrastructure underinvestment, materially constraining the rail transport of major bulk commodities including iron ore and coal. In its FY2025 annual results published in February 2026, Kumba Iron Ore — South Africa's dominant iron ore producer — reported total finished goods inventory of 7.5 Mt, up from 6.9 Mt at end-2024. With rail haulage capacity unable to match mine production, South Africa's major iron ore producers have been compelled to stockpile large volumes at mine sites. To avoid inventory saturation, miners have been forced to proactively revise production guidance downward. While producers are actively addressing haulage constraints, the deeply entrenched structural issues on the rail network are unlikely to be resolved in the short term. Mauritania — SNIM Long-Term Strategic Growth Blueprint Post-2030, attention turns to SNIM's strategic growth roadmap. Under its Horizon 1 programme, the company plans to raise annual production capacity to 45 Mt by 2031, through the implementation of lean manufacturing practices, equipment and technology upgrades, and the co-development of new mineral reserves. Of this total, 20 Mt will be produced under SNIM's wholly owned capacity, while the remaining 25 Mt will be realised through joint ventures with international capital partners. SNIM has further set a long-term target to expand annual capacity to 80 Mt by 2045 under its Horizon 3 plan. Democratic Republic of Congo (DRC) — MIFOR (Grand Est Iron Ore Project) On 26 March 2026, the DRC and China signed a Memorandum of Understanding designating the MIFOR project as a priority flagship initiative. The deposit is estimated to hold cumulative resources of 15–20 bt, with an average grade exceeding Fe 60% — a potential scale approximately 2.5 times that of Guinea's Simandou. Phase I capital expenditure is estimated at USD 28.9 billion, encompassing the construction of a heavy-haul railway and the utilisation of Congo River navigation, ultimately linking to a deep-water port at Banana on the Atlantic coast. Phase I design capacity stands at 50 Mt per annum, with a long-term target of scaling to 300 Mt per annum. These projects collectively underscore Africa's inevitable emergence as an indispensable iron ore supply source for the global steel industry. IV. Global Steel Industry Chain Transformation: Can Africa, as a Hub for High-Grade Ore, Enable DRI Production? High-Grade Ore as a DRI Feedstock Advantage Notably, the majority of Africa's current and planned iron ore projects produce ore at average total iron (Fe) grades predominantly above 65%, with extremely low impurity content. This scarce, high-grade ore is the ideal feedstock for the Direct Reduced Iron (DRI) process. As the DRI-Electric Arc Furnace (EAF) green steel route gains traction across Europe, the Americas, and China, demand for iron ore at Fe 65% and above will grow exponentially on the demand side. This will confer a substantial 'grade premium' on major projects, including South Africa's Kumba, Guinea's Simandou, and other future African producers. Over the longer term, iron ore pricing benchmarks are inexorably shifting away from the traditional Platts 62% Fe index, and African ore producers will gain bargaining leverage when renewing long-term supply agreements, thereby reshaping the global industry chain profit distribution structure. DRI Investment Pipeline in Africa In alignment with global carbon neutrality objectives, international investors — encouraged by local governments — are actively deploying capital into high value-added downstream processing facilities, including DRI plants and high-grade pellet facilities, aimed at leveraging Africa's abundant high-grade iron ore resources and vast renewable energy potential for DRI production. According to SMM observations, Africa is projected to add approximately 20 Mt of DRI capacity by 2030. The largest single project is a Libyan integrated DRI complex, jointly developed by Turkish steelmaker Tosyali and the Libyan National Steel Company, with a total design capacity of 8.1 Mt. China's Decarbonisation Push and the Global Green Steel Transition As China advances its dual carbon targets — carbon peaking by 2030 and carbon neutrality by 2060 — the domestic steelmaking sector is undergoing significant adjustment. The traditional carbon-intensive Blast Furnace–Basic Oxygen Furnace (BF-BOF) long route faces increasingly stringent capacity replacement policies and environmental regulations. Simultaneously, the global trade system is accelerating the imposition of carbon costs, most notably through the EU Carbon Border Adjustment Mechanism (CBAM), compelling global steel supply chains to accelerate the transition from the source toward a low-carbon, ultimately zero-carbon 'green steel' era. In the context of this irreversible transition, the DRI-EAF short-route process has become the most commercially viable decarbonisation pathway. To meet surging global demand for green steel, market projections indicate that global DRI designed production capacity will need to expand by hundreds of millions of tonnes during the 2030s. This scale of expansion will profoundly alter the global steel supply structure: the share of traditional hot metal (pig iron) production will progressively decline, while low-carbon DRI supply will directly determine the competitiveness of major economies in the global green steel market. In particular, 'hydrogen metallurgy' — using green hydrogen to replace natural gas and coking coal as the reductant in iron ore reduction — is widely recognised by the industry as the core technology for achieving ultimate zero-carbon steelmaking. Africa as the Future 'Green Iron' Production Hub Represented by world-class high-grade iron ore projects such as Guinea's Simandou, the progressive commissioning of these mega-mines is expected to inject over 100 Mt of high-grade iron ore per year into the global market, substantially alleviating the global scarcity of DRI-grade ore. More critically, North Africa and West Africa possess world-leading solar and wind energy potential, enabling large-scale, low-cost green hydrogen production in situ. This perfect combination of 'high-grade ore + low-cost green hydrogen' is increasingly inclinng multinational capital and steel majors toward establishing DRI production lines directly on African soil — reducing iron ore to low-carbon Hot Briquetted Iron (HBI) on-site for ocean transport to EAF facilities in Asia and Europe. Africa is thus formally transitioning from its historical role as a raw material exporter to become an indispensable link in the green iron production chain of the future.
Jun 3, 2026 15:28 - [SMM Analysis] Lopal Tech Plans to Take Stake in Australian Listed Company GL1 to Secure Supply from Manna Lithium Mine
Jiangsu Lopal Tech Co., Ltd., through its overseas wholly-owned subsidiary Lopal Tech Perth Pty Ltd (hereinafter referred to as "Lopal Perth") and Global Lithium Resources Limited ("GL1") and MB Lithium Pty Ltd ("MB Lithium", together with "GL1", the "Sellers"), signed the "Tenements and Mineral Rights Sale Agreement". The subject matter of this transaction is the sellers' collectively held exploration tenements for five lithium mines in Western Australia, as well as the lithium mineral rights for another 11 mining areas. The transaction involves lithium exploration tenements located in the Pilbara region of Western Australia, approximately 150 km southeast of Port Hedland. Since acquiring the mineral rights in 2019, GL1 has continuously carried out exploration work on one of the core tenements, E45/4309, completing a total of 734 reverse circulation drill holes and 7 diamond drill holes, with drilling footage exceeding 102.5 km. According to the "Marble Bar Lithium Project Mineral Resource Estimate Report" prepared in 2022 in accordance with the JORC Code, the project has an ore resource of 18 million tonnes with an average lithium oxide grade of 1.0%. Based on relevant data, the mining area still has good exploration potential. The Company engaged a professional team from SRK Consulting (Hong Kong) Limited ("SRK") in December 2025 to conduct an on-site field inspection of the mining area and carry out due diligence regarding the geological conditions, resource estimation and exploration prospects. At the same time, the Company also engaged Australian law firm Herbert Smith Freehills Kramer in December 2025 to provide legal services including due diligence for the project. Pursuant to the agreement, Lopal Tech Perth Pty Ltd acquired the lithium exploration tenements and related assets held by Global Lithium Resources Limited and MB Lithium Pty Ltd in Australia for a consideration of AUD 14.85 million. The lithium mining project will subsequently require exploration, mining licence application, beneficiation and mining capacity construction, with an expected investment of over USD 200 million and a construction and production ramp-up period of approximately 2–3 years. Through its overseas wholly-owned subsidiary Lopal Perth, the Company signed the "Tenements and Mineral Rights Sale Agreement" with the counterparties GL1 and MB Lithium, acquiring the lithium exploration tenements and related assets held by them in Australia, with the transaction amount being AUD 14.85 million. 1. Counterparties (i) Counterparty 1 Name: Global Lithium Resources Limited Registered Address: Level 1, 16 Ventnor Avenue, West Perth WA 6005 Date of Establishment: May 11, 2018 Major Shareholders: As of April 20, 2026, MINERAL RESOURCES LIMITED holds 9.85%, CANMAX TECHNOLOGIES CO LTD holds 9.45%, SINCERITY DEVELOPMENT PTY LTD holds 7.49%, YONGFANG GUO holds 6.23%, DIANMIN CHEN holds 5.32% Principal Business: GL1 is a lithium resource exploration and development company listed on the Australian Securities Exchange, primarily engaged in the exploration, development and future production of hard-rock lithium resources. (ii) Counterparty 2 Name: MB Lithium Pty Ltd Registered Address: Level 1, 16 Ventnor Avenue, West Perth WA 6005 Date of Establishment: June 10, 2021 Major Shareholders: GL1 holds 100.00%; MB Lithium is a wholly-owned subsidiary of GL1. Principal Business: MB Lithium holds the mineral rights related to the Marble Bar Lithium Project. 2. Agreed Product and Technical Specifications Any spodumene concentrate produced from the Manna Lithium Project with a lithium oxide (Li₂O) content of not less than 5% and meeting the specifications agreed by both parties. The Company has the right to reject products with a lithium oxide content of less than 4.5%. 3. Supply Term The initial term is 10 years from the date of the first supply of the agreed product. Subject to satisfaction of the relevant conditions, the Company has the right to extend the initial term by 4 years by giving notice within one month prior to the expiry of the initial term. 4. Supply Volume GLR shall supply to the Company annually 40% of the actual annual production of spodumene concentrate from the Manna Lithium Project. GLR shall use its best efforts to achieve an annual supply volume of at least 70,000 tonnes of the agreed product. 5. Product Pricing The pricing of the supplied products is based on the average of price indices published by SMM , Fastmarkets, Benchmark Minerals Intelligence, Asian Metal, Platts S&P Global and other agencies, subject to a certain price concession. 6. Supply Shortfall If a supply shortfall occurs during a contract year, GLR shall use reasonable efforts to make up such shortfall within three months after the end of the relevant contract year. If GLR fails to provide the shortfall supply to complete the delivery within such three-month period (the "rectification period"), GLR shall pay in full the price difference to the Company within 30 days after the end of the rectification period. 7. Prepayment Amount Subject to satisfaction of the conditions precedent for the prepayment, the Company shall pay GLR a prepayment of not more than US$75 million (the "Maximum Amount"), which shall be strictly used for the development expenditure of the Manna Lithium Project and the operation of the project after its completion. When the Company accepts the agreed products, such prepayment shall be applied to offset the payable purchase price in batches. Considering the extended period of the prepayment, GLR shall pay the Company a funding fee calculated at a compound annual interest rate of 5%. 8. Overview of the Investment Target GL1 (ABN 58 626 093 150) is an Australian listed company located in Western Australia, primarily engaged in the exploration and development of lithium resources. Its core asset, the Manna Lithium Project, is located 100 km east of Kalgoorlie, Western Australia, and is the third largest lithium resource project in the resource-rich Eastern Goldfields region. The project has a mineral resource of 51.6 million tonnes with an average lithium oxide grade of 1.0%. GL1 holds and operates the Manna Lithium Project through its wholly-owned subsidiary GLR (ACN 653 130 575). GL1 has obtained the mining lease for the lithium project and completed the project feasibility study. GLR expects to make a final investment decision (FID) for the Manna Lithium Project by the end of 2026. Following the FID, GLR will commence project construction, and the lithium project is expected to commence shipments in June 2028. This transaction represents an important measure for the Company to anchor its core business of lithium iron phosphate cathode materials and deepen its upstream resource layout. Currently, the Company's lithium iron phosphate business continues to expand in production and sales volume, its overseas capacity is progressing steadily, and the demand for stable supply and cost control of upstream lithium resources is increasing. Through this transaction, the Company will further enhance its lithium resource security capability, strengthen raw material supply stability and anti-cyclical resilience, improve vertical integration and overall competitiveness, which is in line with the Company's long-term development strategy and the interests of all shareholders. Source: China Securities Journal
Apr 22, 2026 17:39 - [SMM In-Depth Analysis] From 90 Million to 260 Million, Production More Than Doubled, the Largest Iron Ore Production Region Outside Australia and Brazil: A Comprehensive Analysis of African Iron Ore
Over the past half-century of industrialisation, the global seaborne iron ore market took shape and solidified into a "duopoly" supply structure dominated by Australia's Pilbara region and Brazil's Carajás and Iron Quadrangle regions. However, with the evolution of macroeconomic cycles, the structural shift in China's economic growth momentum, and the historic imperative for the global steel industry to transition toward low-carbonisation and green development, this traditional supply landscape is undergoing an unprecedented reshaping. On November 26, 2025, as the first commercial vessel loaded with Simandou iron ore slowly departed Mabariya Port for the open sea, Guinea's Simandou iron mine officially commenced production. As the world's largest and highest-quality greenfield iron ore project, this milestone signalled the gradual rise of the African continent—long relegated to a secondary position—as an important emerging force in the global ferrous metals market. Why should we pay attention to the African market? The African continent's iron ore resources are regarded as the third most important region for global iron ore supply, after Brazil's Carajás region and Australia's Pilbara region. The sheer scale and high grade of its resources account for 13.8% of global iron ore resources. It is also set to be the primary supply-side growth driver over the next five years. Therefore, changes in African iron ore will long remain a key market determining international iron ore prices . This article provides a comprehensive analysis of the current status and landscape of African iron ore and select steel markets, offers an in-depth discussion of future development trends, and presents a data-driven outlook on market changes. I. Global Iron Ore Background According to SMM survey data, as of 2025, global iron ore production is estimated at approximately 2.472 billion mt. Of this, Africa contributed approximately 95 million mt, accounting for nearly 4% of total global production. With the successive commissioning of various large-scale mining projects, Africa's iron ore capacity is expected to double by 2030, reaching a scale of nearly 259 million mt. Assuming no production cuts in other regions, Africa-produced iron ore's global market share is expected to rise to nearly 10%, while the global iron ore market's oversupply is estimated to increase to approximately 220 million mt. (Chart-1: Balance Sheet) Although the international iron ore market has already entered a prolonged cycle of loose supply, the substantive supply shock from African iron ore is expected to materialise gradually only over the next five years. In the short term, based on an estimated 15 million mt of new African shipments in 2026, their outstanding high-grade characteristics are expected to quickly meet steel mills' current demand for low-carbon ore blending, allowing the market to absorb them smoothly, with a relatively mild impact on absolute international iron ore prices. The key point to watch will be from 2028 to 2029. As railway, port, and other infrastructure facilities still under development in Africa are fully connected, the surge in high-grade iron ore production will exert heavy downward pressure on the right side of the global iron ore cost curve. This will not only systematically push down the price center of iron ore but also trigger intense structural squeeze; that is, the survival space for low-grade, high-cost mines will be significantly compressed. This price downcycle is expected to persist through 2028. When international ore prices fall below the marginal cost support level of $90/mt, non-mainstream small mines on the far right of the cost curve will be forced to shut down and exit the market. By then, the global iron ore supply landscape will have completed a new round of reshuffle, re-forming a multi-oligopoly ecosystem dominated by ultra-large, low-cost mines (including new African mines), supplemented by quality mid-sized mines. (Chart-2: Price Forecast Curve) II. African Market Current Landscape: South Africa as the Dominant Leader with Multiple Strong Players, West African Countries Actively Expanding Having analyzed the foundation of the global iron ore market landscape, the focus will now shift to the overall situation in Africa. As the primary driving force behind supply growth over the next five years, Africa's iron ore production is concentrated in West Africa and South Africa. Currently, Africa is dominated by three major countries. Among them, South Africa is the largest producer, with production reaching approximately 67 million mt in 2025, and its export shipments firmly hold an absolute dominant position of approximately 65% of Africa's total iron ore exports. However, constrained by potential structural limitations, the future organic growth potential of South Africa's iron ore industry is relatively limited. As major iron ore projects in other emerging resource-rich African countries successively come into production and release capacity, South Africa's share in Africa's overall export market is expected to face sustained contraction. Next is Mauritania, as Africa's second-largest iron ore producer, with production of 15 million mt in 2025 and export volumes of approximately 12 million mt, accounting for 12% of the African market. Mauritania borders the Atlantic Ocean, possesses abundant high-grade iron ore deposits deep in the Sahara Desert, and enjoys exceptionally favorable geographic location and mineral resources. Moreover, it is within close proximity to European and Middle Eastern markets that urgently need green industrial raw materials, providing it with unique advantages for absorbing the global transfer of green metallurgical capacity. It will be a highly promising iron ore supplier in the future. In addition, Sierra Leone, as another important supply hub in the region, also has an expected production of 12 million mt in 2025, holding a stable share of approximately 12% in the African export market. Chinese-invested iron ore mines within the country are actively expanding their operations. Macro trade flow perspective, based on full-year 2024 trade data, the proportion of African iron ore shipped to the Chinese market was relatively low compared to traditional mainstream mining regions, accounting for only about 60%, while the broader Asian market encompassing China, Japan, and South Korea collectively absorbed approximately 70% of African iron ore shipments. Meanwhile, Western European countries represented by the Netherlands and Germany constituted the core secondary shipping destination for African iron ore, with a trade flow share of nearly 14%. The remaining marginal trade flows exhibited a diversified pattern, radiating broadly to emerging steel capacity clusters in the Middle East, including Bahrain, Oman, and Saudi Arabia. (Chart-3: African Iron Ore Market Overview) Enterprise level, Kumba Iron Ore and Assmang , both based in South Africa, became Africa's largest and second-largest iron ore producers with annual production of 37 million mt and 17 million mt, respectively. Kumba's mines such as Sishen are globally renowned for producing high-grade fines (>62%) and premium lump with excellent physical and metallurgical properties (Premium Lump, Fe 65.2%). Under the current trend of blast furnace emission reduction, this type of lump ore that can be directly charged into furnaces and reduce sintering carbon emissions has been highly sought after by the market, commanding a significant premium. Assmang also possesses high-quality iron ore assets, jointly controlled by African Rainbow Minerals (ARM) and Assore at a 50:50 ratio. Its Assmang fines and Assmang lump (grade at 64-65%) are also high-quality direct furnace charge materials. However, for this enterprise, the biggest bottleneck lies not at the pit head but on the rails. Heavy reliance on Transnet's rail shipping capacity means that logistics bottlenecks frequently cap its shipment volumes. SNIM (Société Nationale Industrielle et Minière de Mauritanie) is Mauritania's state-owned mining company and Africa's third-largest iron ore producer after the two South African companies. Unlike mainstream Australian and Brazilian ore, SNIM's products occupy a unique niche in terms of physicochemical specifications and market segmentation. Its most widely traded product is TZFC fines, characterized by extremely low aluminum (Al2O3) and phosphorus (P) content. As an excellent blending raw material, major steel mills prefer to blend SNIM ore fines with high-aluminum Australian fines (such as certain Pilbara blend ores) to significantly dilute the impurity ratio in furnace charge and optimize blast furnace performance. (Chart-4: Top-Tier Enterprises) III. Transformation of the African Market: Major Producing Countries May Stagnate While Emerging Projects Become Key Growth Drivers So where will future growth come from? According to SMM observations, the African market is expected to undergo significant structural changes over the next five years. Multiple large-scale iron ore projects across African countries are already under construction and plan to commence production before 2030. Based on estimates, Africa's iron ore supply is expected to grow substantially from approximately 95 million mt currently to 260 million mt over the next five years, representing a cumulative increase of up to 85%. The market landscape will also shift from South Africa-dominated exports led by Western players to Guinea-dominated exports. (Chart-5: African Market Production Trend) The primary growth driver will come from Guinea in West Africa. The country's renowned Simandou iron ore mine, jointly developed by multiple enterprises, is currently the world's largest undeveloped high-grade open-pit hematite deposit. With resource reserves exceeding 5 billion mt and a designed capacity of 120 million mt, it is the project with the greatest strategic potential to reshape the existing iron ore market landscape. Since the first ore shipment in late November 2025, as of Q1 2026, Simandou's main export port, Morebaya Port, has cumulatively shipped nearly 1.6 million mt. Blocks 1 and 2, developed under the leadership of the Winning Consortium Simandou (WCS), have been successfully commissioned, with 2026 capacity expected to be achieved and shipments expected to reach full production of 60 million mt within the next 2–3 years. Blocks 3 and 4, which are expected to commence production in Q1 2026, are led by Simfer (a Rio Tinto & Baowu joint venture) and are expected to ship 5 million mt of ore in 2026, reaching full production of 60 million mt over 30 months. In other words, Guinea is expected to reach 120 million mt before 2030, vaulting to become the world's second-largest iron ore project, behind only Brazil's S11D project (with a post-expansion designed capacity of 200 million mt, expected to commence production in 2030). Other countries such as Liberia, Gabon, Sierra Leone, and Congo Republic all have iron ore projects under development, with a combined capacity of approximately 46 million mt planned to commence production by 2030. The largest among these is the Tokadeh Phase II project (Tokadeh Phase II) in Liberia, owned by ArcelorMittal (AML), which is expected to commence production in H2 2026 and reach full production of 20 million mt capacity by year-end, with iron ore concentrate expected to exceed Fe 66%. Given that AML's steelmaking capacity in Europe cannot absorb such a massive increase in the short term, the majority of Tokadeh 's products are expected to flow into the international market for trading, exerting downward pressure on iron ore concentrate prices. Currently, the largest exporting country, South Africa, is expected to largely maintain its production within the range of 63–67 million mt, with a risk of slight decline. The primary reason is that South Africa's iron ore transportation is highly dependent on the heavy-haul railway line (TFR) from Sishen to Saldanha Port. In recent years, Transnet Freight Rail (TFR), under South Africa's national transport company Transnet, has seen a significant decline in transport capacity due to numerous issues including locomotive and rolling stock shortages, frequent cable theft, and prolonged underinvestment in infrastructure, resulting in severely reduced transportation capacity for major bulk commodities such as iron ore and coal. South Africa's largest iron ore mine, Kumba, in its 2025 year-end financial report released in February 2026, indicated that its total finished product inventories reached as high as 7.5 million mt , increasing rather than decreasing compared to 6.9 million mt at the end of 2024. As railway transport capacity failed to match mine production capabilities, major South African iron ore producers were forced to accumulate large inventories at mine sites. To prevent inventory overflow, miners had to proactively lower production guidance. Although miners have been working to address transportation issues, the deep-rooted railway problems are difficult to resolve in the short term. Beyond 2030, there is also Mauritania's SNIM strategic growth blueprint. In the first phase (Horizon 1), the company plans to raise annual capacity to 45 million mt by 2031 through implementing lean production, equipment and technology upgrades, and joint development of new reserves. Of this, 20 million mt will be absorbed by SNIM's own wholly-owned capacity, while another 25 million mt will be achieved through attracting international capital to form joint ventures. Furthermore, SNIM has even set its sights on 2045 (Horizon 3), formulating a long-term goal of raising annual capacity to 80 million mt . In addition, there is the MIFOR project in the DRC. On March 26, 2026, the DRC signed a relevant memorandum of understanding with China, and the MIFOR project was listed as a flagship project with priority support. The mine is estimated to hold cumulative resources of 15 billion to 20 billion mt, with an average grade exceeding 60%. Its potential scale is considered to be approximately 2.5 times that of the Simandou project in Guinea. The first phase of the project is expected to cost $28.9 billion, involving the construction of a heavy-haul freight railway combined with Congo River shipping, ultimately connecting to the Banana deep-water port on the Atlantic coast. Initial annual production is expected to be 50 million mt, with a long-term goal of expanding to 300 million mt per year . All these projects are destined to make Africa an indispensable source of iron ore supply in the future. (Chart-6: Selected African Iron Ore Projects) IV. Global Steel Industry Chain Transformation: Will Africa, as a Hub of High-Grade Ore, Empower DRI Production? Notably, most of Africa's currently operating and planned iron ore projects have an average total iron grade (Fe) largely above 65% , with extremely low impurity content. This scarce high-grade ore is an ideal raw material for the direct reduced iron (DRI) process. As the DRI-EAF green steel route gains traction in Europe, the US, and China, future demand for iron ore with grades of 65% and above will surge exponentially. This will confer an exceptionally high "grade premium" on major iron ore projects including South Africa's Kumba, Guinea's Simandou, and other mines coming into production in the future. In the long run, the pricing benchmark for iron ore is inevitably shifting away from the traditional Platts 62% index, and African miners will gain bargaining leverage when renewing long-term agreements, thereby reshaping the global industry chain profit distribution landscape. In line with the global carbon neutrality trend, international investors, encouraged by local governments, are actively deploying high-value-added processing facilities, including DRI plants and high-grade pellet plants, aiming to fully leverage Africa's abundant high-grade iron ore resources and enormous energy potential for DRI production. Based on SMM's observations, approximately 200,000kt of DRI capacity is expected to emerge in Africa by 2030. The largest project among them is an 8.1 million mt DRI complex located in Libya, a joint venture between Turkish steel mill Tosyali and Libya's national steel company. (Chart-7: African DRI Projects) As China advances its "dual carbon" goals, the steelmaking industry is undergoing corresponding adjustments. China has set out a strategic blueprint for carbon peaking by 2030 and carbon neutrality by 2060. The traditional high-carbon-emission long-process steelmaking route dominated by blast furnace-converter operations is facing extremely stringent capacity replacement policies and environmental protection regulations. Meanwhile, the global trade system is also accelerating the imposition of carbon costs — for example, the implementation of the EU's Carbon Border Adjustment Mechanism (CBAM) — compelling the global steel supply chain to accelerate its transition from the source toward a low-carbon or even zero-carbon "green steel" era. Under this irreversible transformation trend, the short-process route combining DRI with electric furnace (EAF) has become the most commercially feasible decarbonization pathway. To meet the surging global demand for green steel in the future, market forecasts indicate that by the 2030s, global DRI designed capacity will need to increase by hundreds of millions of metric tons. This dramatic expansion in production scale will profoundly reshape the global steel supply landscape. The share of traditional pig iron production will gradually decline, while low-carbon DRI supply will directly determine the competitiveness of major economies in the global green steel market. In particular, the "hydrogen metallurgy" technology, which uses green hydrogen to replace natural gas and coal for iron ore reduction, is widely recognized by the industry as the core to achieving ultimate zero-carbon steelmaking. (Chart-8: Reshaping of the Steel Industry Chain Under Green Transformation) Represented by world-class high-quality iron ore projects such as Simandou in Guinea, the gradual commissioning of these super mines is expected to inject over 100 million mt of high-grade iron ore supply into the global market annually, significantly alleviating the global shortage of DRI-grade ore. More critically, North Africa and West Africa possess solar and wind energy potential that is second to none globally, enabling large-scale green hydrogen production at extremely low costs locally. This perfect combination of "high-grade ore + affordable green hydrogen" has led multinational capital and steel giants to increasingly favor establishing DRI production lines directly on African soil, reducing iron ore locally into low-carbon Hot Briquetted Iron (HBI) that is convenient for transport, before shipping it to electric furnaces in Asia and Europe for smelting. As a result, Africa will formally transition from the old era to become an indispensable part of the green iron production chain.
Apr 8, 2026 14:52 - Middle East Oil Prices Surge Past $150! Everything You Need to Know: Is Iran’s Threat About to Become Reality?
Iran’s threat to drive oil prices up to $200 a barrel may sound like hyperbole, but as the energy crisis persisted, that outcome already looked more likely than US President Trump’s prediction that oil prices would soon pull back to pre-war levels… The conflict involving Israel and the US against Iran entered its third week — and escalated into one spanning the entire Middle East — yet the global oil benchmark’s response so far was surprisingly “mediocre.” Brent crude oil was currently trading near $100 a barrel, up about 65 from the start of the year. Although that level would have been unimaginable just a few weeks ago, it still remained below last Monday’s brief peak of nearly $120. Given that since the conflict began, the effective closure of the Strait of Hormuz had trapped about one-fifth of global oil supply — roughly 20 million barrels a day — crude oil prices should, in theory, have been much higher. That seemed to suggest investors still retained a degree of trust in Trump , betting that the crisis would be resolved quickly and that the Strait of Hormuz would soon reopen — whether it was called the “Trump put,” the “TACO trade,” or “buy Trump,” many oil traders appeared to be wagering that the president would ultimately be able to limit the market damage. “When this is over, oil prices will come down very, very quickly,” Trump said on Monday this week. Yet that optimism looked increasingly difficult to reconcile with realities on the ground — whether on a battlefield where the conflict was intensifying, or in the physical oil market, where supply bottlenecks were steadily spreading. Signals Being Overlooked In fact, the physical crude oil market was sending an increasing number of stress signals, even though the international benchmark “paper oil” market had so far largely ignored them. Although trade had stalled under the impact of the Iran conflict, Middle Eastern crude benchmarks still surged to record highs, making them the most expensive crude in the world. The spike in these benchmark indicators, which are used to price millions of barrels of Middle Eastern crude sold to Asia, was raising costs for Asian refiners and forcing them to seek alternatives or make further production cuts in the coming months. S&P Global Platts said Dubai spot crude assessments for May-loading cargoes hit a record $157.66 a barrel on Tuesday, surpassing the previous all-time high of $147.5 set by Brent crude oil futures in 2008. That left Dubai crude’s premium to swaps at $60.82 a barrel, compared with an average premium of just 90¢ in February. Meanwhile, Oman crude oil futures hit a record high of $152.58 per barrel on Tuesday, with its premium to the Dubai swap set at $55.74 per barrel, versus an average premium of just 75¢ in February. Oman crude oil is exported from a terminal outside the Strait of Hormuz. This surge reflected massive uncertainty over actually available supply in the Middle East after Iran repeatedly attacked Oman's oil terminal and the UAE's major oil export terminal of Fujairah outside the Strait of Hormuz. Are Brent and WTI Failing to Reflect the "True Severity" of the Oil Market? As JPMorgan's head of commodities, Natasha Kaneva, pointed out in her latest research note on Tuesday , there was a clear mismatch between international benchmark crude pricing and the Middle Eastern geography of the supply disruptions. The core issue was that Brent and WTI are benchmark indicators at opposite ends of the Atlantic basin, while the current shock is concentrated in the Middle East. As a result, these benchmark crude prices were particularly influenced by relatively loose regional fundamentals—commercial oil inventory in both the US and Europe were ample in early 2026, and supply across the Atlantic basin was also relatively abundant in the short term. In addition, expectations for a release from the US Strategic Petroleum Reserve (SPR)—as well as a partial release that will soon materialize—further eased prompt tightness in Brent- and WTI-linked markets. By contrast, Middle Eastern crude benchmarks such as Dubai and Oman more accurately reflected the current dislocation in the physical market. Dubai and Oman spot prices were both trading above $150 per barrel, underscoring the severity of crude oil shortages originating in the Gulf region. These Middle Eastern oil prices were directly affected by export disruptions and therefore more effectively reflected marginal supply deficits than Atlantic-linked crude prices. Crucially, trade geography intensified this dynamic. Most of the crude transported via the Strait of Hormuz goes to Asia—before the outbreak of the Middle East conflict, about 11.2 million barrels of crude and 1.4 million barrels of refined products flowed through the strait to Asia each day. As a result, the direct physical shortage—and the surge in oil prices—was concentrated in Asian markets most dependent on Gulf crude. In fact, early signs of demand destruction had already emerged in Asia as product prices surged and spot crude became prohibitively expensive. JPMorgan noted that timing effects further reinforced this divergence. A typical voyage from Gulf Cooperation Council (GCC) countries to Asia takes about 10 to 15 days, while cargoes bound for Europe via the Suez Canal require nearly 25 to 30 days, or 35 to 45 days if rerouted around the Cape of Good Hope. Therefore, the impact of disrupted Gulf flows would hit Asian markets sooner and more severely, while Atlantic Basin benchmarks such as Brent and WTI would enjoy a longer buffer because of surplus inventory and slower supply adjustments. The US, with crude oil production exceeding 13 million barrels per day, would be affected the least. JPMorgan believed that, in this context, the apparent price stability shown by Brent and WTI should not be taken as evidence of adequate global supply. It reflected a temporary buffer created by regional surplus inventory, benchmark composition, and policy intervention. In fact, for refiners, especially those in Asia, the current crude oil shortage had already become a serious problem. About 60% of the region’s crude oil imports depended on the Middle East, and the difficulty of finding alternative, timely supplies was rapidly becoming acute. The pressure had already forced many countries into painful adjustments. Refiners across Asia had begun cutting run rates to conserve dwindling inventory. Some countries had banned exports of refined products, a defensive move that could further tighten the global market. As the crude oil shortage worsened, refined product prices surged. Asian jet fuel prices were approaching $200 a barrel, near the record high of about $220 reached earlier this month. The Crisis Could Spread Further Ultimately, this crisis was expected to extend beyond Asia. Data from analytics firm Kpler showed that Europe accounted for about three-quarters of Middle Eastern jet fuel exports shipped through the Strait of Hormuz last year—about 379,000 barrels per day—but since the conflict began, no such cargoes had passed through the strait. Unsurprisingly, jet fuel barge prices in the Amsterdam-Rotterdam-Antwerp refining hub had surged to a record $190 a barrel, exceeding the previous peak set after the Russia-Ukraine conflict in February 2022. The comparison with the Russia-Ukraine crisis may be even more compelling. Before the outbreak of the Russia-Ukraine conflict in 2022, Russia supplied about 30% of Europe’s crude oil imports and one-third of its refined product imports. As traders feared Europe would lose supplies from one of the world’s largest oil producers, Brent crude rose to $130 a barrel after the Russia-Ukraine conflict—even though that worst-case scenario never fully materialized in the end. By contrast, according to Morgan Stanley, the physical disruption caused by the Iran conflict had already exceeded that level of concern by more than threefold. Even if the Strait of Hormuz were to reopen immediately, it would not bring immediate relief. According to the International Energy Agency, about 10 million barrels per day of production in the Middle East has been shut in since the conflict began. Restoring these flows will take weeks, if not months. To be sure, the oil market entered the Iran conflict in a relatively loose state, and the International Energy Agency had projected that global supply would exceed demand by about 3.7 million barrels per day. But that surplus has now been erased by the current turmoil. Last week, the International Energy Agency announced plans to release a record 400 million barrels from member countries' strategic petroleum reserves, which will help cushion the initial shock. But drawing down inventories cannot substitute for deliveries of new oil. In other words, the supply shock to the oil market is real and may persist. Once the Strait of Hormuz finally reopens, oil prices could initially plunge in a relief rebound, but given the harsh realities of the physical market, traders may need to think twice before betting that the return to normalcy promised by Trump is about to arrive…
Mar 18, 2026 11:26 - [SMM Hot Topic Analysis] Can the Iron Ore Price Dam Hold Under Heavy Supply Pressure?
I. Supply-Demand Pattern Shift Puts Iron Ore Prices on a Downtrend In 2021, driven by inflation expectations from global quantitative easing, frequent supply-side disruptions in Brazil and Australia, resilient demand in China, and strong speculative sentiment, iron ore prices hit a record high of $219.77/mt in July that year, with Platts’ annual average price as high as $160/mt ; they then entered a prolonged downtrend. In 2025, the annual average iron ore price was $102, down about 36% from the 2021 average. Source: SMM Iron ore prices have continued to fall in recent years, mainly due to the global project investment boom spurred by high prices before 2021. After 2024, multiple large iron ore projects worldwide entered a concentrated commissioning phase, and the market’s supply-demand pattern shifted from tight to loose, with the supply-demand gap widening from -12 million mt to 46 million mt. Meanwhile, China has implemented crude steel production cuts since 2022, significantly curbing iron ore demand. Coupled with persistent weakness in real estate, an overall downturn in the steel industry, and an overseas economic slowdown, among other factors, iron ore demand declined markedly. Entering 2025, a rebound in China’s steel exports drove iron ore demand to increase slightly, while capacity in emerging steel-producing countries such as Southeast Asia was gradually released, narrowing the supply-demand gap somewhat. Over the long term, however, iron ore supply is still on a growth trend, market expectations remain bearish, and prices are pressured to set new lows repeatedly. Source: SMM (the forecast assumes an extreme balance under normal commissioning of new mines and no voluntary production cuts by mines) II. Mine Costs Form a Solid Bottom Support for Iron Ore Prices From the global iron ore cost curve, about 90% of global mine cash cost is no higher than $85/mt, and about 93.8% is no higher than $90/mt. International mining giants represented by FMG, BHP, Rio Tinto, and Vale have costs far below those in China and other non-mainstream countries, forming the main body on the left side of the cost curve in the chart—low and relatively flat—which explains their strong cost competitiveness and earnings resilience in the global market. At present, the $85-90 cost line is the lifeline for the vast majority of mines; once prices remain below this range for an extended period, high-cost capacity will be forced to exit, thereby supporting prices. China’s iron ore mines due to low raw ore grade and high underground mining costs, among other reasons, currently have a nationwide per-mt processing cost of about 595 yuan/mt, equivalent to around $85 . Its costs have long been at the high end globally, serving as the "anchor point" and "ceiling" of the cost curve. The high cost and low production of China's domestic iron ore mines have led the steel industry to heavily rely on imports for raw materials, and fluctuations in international ore prices directly impact the profit stability of the domestic steel industry. Therefore, promoting domestic resource supply, investing in low-cost overseas resources, and developing steel scrap recycling are crucial for the strategic security of China's steel industry. Data source: SMM III. The global iron ore supply has long been characterized by a landscape dominated by the "Big Four" mines, supplemented by "non-mainstream" mines. Currently, the iron ore production industry is highly concentrated, primarily following a pattern dominated by the "Big Four" mines, supplemented by "non-mainstream" mines. Australia and Brazil have long contributed over half of the global iron ore production. Australia, leveraging advantages such as high resource concentration, low mining costs, and stable supply, firmly holds its position as the world's largest producer and exporter; while Brazil is renowned for its high-grade ore and is the world's second-largest iron ore exporter. Data source: SMM The "Big Four" mines, consisting of Rio Tinto, BHP, FMG, and Vale, have long dominated global iron ore supply, accounting for approximately 70% of global production. Data source: SMM The Rise of Emerging Mines Promoting the Multipolar Development of Global Iron Ore In recent years, India has actively promoted domestic mining development, leading to a significant increase in production; since 2023, its iron ore production has surpassed that of China, and it shows a continuous expansion trend, maintaining an annual growth rate of 7%, gradually becoming a new force in regional supply growth. Emerging enterprises such as India's National Mineral Development Corporation (NMDC) and South Africa's Anglo American are gradually expanding capacity, enhancing their influence in the international market. Meanwhile, countries such as Russia, Kazakhstan, Iran, and regions in Africa are also actively developing domestic iron ore resources, seeking to increase their voice in regional markets, driving the global iron ore supply landscape from high concentration towards gradual multipolar development. Data source: SMM IV. Australia Firmly Holds the Top Spot, India Becomes a New Growth Engine From the perspective of major producing countries, Australia still firmly ranks first globally, with iron ore production of approximately 900 million mt in 2025, accounting for one-third of the global total, and maintaining a stable annual growth rate of about 2%. Brazil ranks second; after the 2019 dam collapse, production once fell sharply. Although it has recovered somewhat over the past two years, the increase has been relatively limited. China’s production scale is relatively large, but due to frequent safety incidents and the continued impact of the environmental protection-driven production restriction policy, production has not increased but instead declined in recent years. By contrast, India, as an emerging producer, has seen production rise steadily over the past decade, and is expected to post an increase of about 7% by 2030. Source: SMM V Over the next three years, the world will usher in a new peak in mine commissioning In addition to supply from existing mines, there are currently multiple large-scale iron ore projects under construction worldwide, with the number of mines expected to be commissioned in 2026 at six, mainly located in Africa and Brazil. Representative projects include Vale’s northern expansion “S11D +20mtpa,” the northern block of Guinea’s Simandou iron ore project, and the Nimba iron ore project. 2026 will be the year with the most concentrated new supply over the next three years. With the northern block of Simandou officially commencing production, the overall capacity ceiling of the mining area will, with capacity ramp-up, rise to 120 million mt, becoming the core incremental source of global iron ore supply over the next five years. From 2027 to 2028, projects expected to commence production will mainly come from China, including the Xi’an Mountain iron ore mine and the Honggenan iron ore mine, adding about 25 million mt of iron ore supply to the domestic market. Overall, as emerging producers continue to release capacity, and traditional suppliers such as Australia and Brazil consolidate their export advantages through expansion projects, the global iron ore supply structure will become more diversified. A new cycle of capacity release has gradually begun, and the loose supply landscape is expected to continue deepening over the next several years. Source: SMM Simandou Project Commissioning Reshaping the Global Iron Ore Supply Landscape Among the many new projects, Africa’s Simandou iron ore is particularly noteworthy. The mine is expected to reach annual capacity of 120 million mt, and the ore’s average grade exceeds 65%, providing the market with a high-grade, high-quality option beyond Australia and Brazil, and becoming an important variable in the recent contest over the global iron ore supply landscape. In terms of project progress, the Simandou iron ore project has entered a substantive shipment phase; as logistics corridors are gradually opened up, the mining area’s substantive impact on global supply will gradually become evident. Source: SMM Nearly 400 million mt of Capacity Release by 2030, Global Iron Ore Market Faces Impact With the entry of emerging producers, iron ore supply is beginning to diversify. Projects led by Simandou iron ore are breaking the industry landscape and taking the iron ore market into a new stage. Looking ahead to the next five years, global iron ore capacity is expected to see a wave of concentrated releases, with incremental supply mainly coming from two major regions: Africa and Australia . Leveraging the development of new high-grade mines such as Simandou, Africa is reshaping the global supply landscape; meanwhile, Australia, relying on its existing capacity base and ongoing expansion projects, is further consolidating its export-dominant position. Overall, the global iron ore supply landscape is evolving toward greater diversification and a looser market. Source: SMM VI Simandou High-Quality Iron Ore Enters the Market; Global Iron Ore Enters an Era of “Quality Upgrading” As some older mines gradually enter a period of resource depletion , coupled with the fact that many newly commissioned projects are dominated by mid- to low-grade ore, the average global iron ore grade shows a downward trend from 2025 to 2026 . However, as high-grade mines such as Simandou are commissioned one after another, the share of high-grade ore supply is expected to increase, and is projected to drive a rebound in the overall global iron ore grade in 2027. Source: SMM VII “Green Steel” Reshapes the Global Crude Steel Production Landscape From a policy perspective, the low-carbon transition represented by “green steel” is profoundly reshaping the global crude steel production landscape . Whether in China or Europe, carbon neutrality has become the core theme for the future development of the steel industry. Therefore, whether it is China’s ongoing capacity replacement policy or the EU’s Carbon Border Adjustment Mechanism (CBAM) that is about to be fully implemented , both clearly indicate that the global steel industry is accelerating its transition toward low-carbon and green development. Achieving carbon neutrality across the entire industry chain is no longer an isolated task for a single link, but must rely on close upstream-downstream coordination and deep integration of technological pathways. Source: SMM Technology Reshaping: Green Iron Supply + Green Production Demand Against the broader backdrop of carbon neutrality, merely maintaining the current supply-demand structure dominated by iron ore can no longer meet future low-carbon requirements. The deeper need of industry transformation lies in reconstructing metallurgical processes: resource-rich countries—such as Australia and Brazil, traditional major iron ore exporters—need to fully leverage their renewable energy endowments and mineral advantages, shifting from simply exporting iron ore to producing high-grade, low-carbon-footprint direct reduced iron (DRI) or hot briquetted iron (HBI) and other high value-added intermediate products. By shipping this clean-energy-driven “green DRI” to steel consumption hubs and integrating it with local green electric arc furnace (EAF) processes, it can effectively replace the traditional “blast furnace–converter” long process, thereby substantially reducing carbon emissions at the source. This multinational collaborative model of “high-quality resources + green energy + short-process” is not only a critical measure to address trade barriers such as the Carbon Border Adjustment Mechanism, but also an essential pathway to build a new global green steel supply chain and drive deep decarbonization across the industry. Data source: SMM Rising Share of Electric-Furnace Steelmaking, Stronger Substitutability of Steel Scrap, Squeezing Iron Ore Demand Driven by carbon-neutrality targets, the steel industry, as a major source of carbon emissions in the industrial sector, has drawn close attention for its emissions-reduction pathway. Among these, the traditional long-process route centered on “blast furnace–converter,” due to its heavy reliance on coke and iron ore, is regarded as a primary source of carbon emissions and has therefore become a key focus of regulation and retrofitting in various countries. By contrast, the short-process route represented by “steel scrap–electric furnace,” with a significantly lower carbon-emissions intensity, is being favoured by an increasing number of countries. This structural shift has driven the share of electric-furnace steelmaking in global crude steel production to continue rising. Data source: SMM From an economic perspective, the substitution relationship between steel scrap and pig iron is typically measured by the price spread. Generally, after factoring in steelmaking costs and losses, pig iron costs should be about 100-150 yuan/mt higher than steel scrap prices ; this range is viewed as the cost-performance equilibrium band: if steel scrap prices are lower than pig iron costs by more than this threshold, steel scrap is more economical; otherwise, pig iron has a more pronounced advantage. In 2025, the average price spread between pig iron and steel scrap was 122 yuan/mt, lower than the 2024 average of 211.8 yuan/mt, and also largely within the cost-performance equilibrium band. By contrast, the 2024 spread was significantly above the upper limit of the equilibrium band, indicating that steel scrap offered a more prominent cost-performance advantage at that time. After the spread narrowed in 2025, the economic advantage of steel scrap weakened somewhat. As a result, in the short term, there is limited room for China to increase the share of electric-furnace steelmaking; overall, it remains at a relatively low level and still lags far behind the global average. This also reflects that, at the current stage, cost factors still impose a substantive constraint on the choice of smelting process routes. Data source: SMM Taken together, the blast furnace–converter long-process route will remain the dominant model for global steel production over the next five years, but the shares of electric furnaces and steel scrap usage will increase year by year; in the long run, this trend will suppress iron ore demand, causing it to weaken gradually. Data source: SMM VIII Global Total Iron Ore Demand in 2030 to Be About 2.4 Billion mt, with Gradual Shifts in Global Flows As China began encouraging domestic steel mills to develop overseas markets while adjusting the domestic industry chain’s transformation toward producing high value-added products needed by the manufacturing sector, global crude steel production began to rebound gradually. Data Source: SMM From the perspective of the global demand structure, although crude steel production outside China is entering a new round of development, with capacity expansion particularly notable in regions such as India and Southeast Asia, a considerable portion of the incremental increase comes from electric furnace processes, providing limited substantive boost to iron ore demand. Meanwhile, as the world’s largest iron ore consumer, China’s crude steel production has entered a downward trajectory, constituting the primary source of demand-side reductions. Overall, overseas increments are unlikely to fully offset China’s reductions. It is expected that by 2030, total global iron ore demand will be approximately 2.4 billion mt, with overall growth trending toward a slowdown. Compared with the mild growth on the demand side, the supply side remains in a phase of continuous expansion. The oversupply landscape will become an important factor that suppresses ore prices over the long term. Data Source: SMM SMM will continue to track the impact of changes in iron ore supply and demand on prices. Comments are welcome—scan the code to follow us! Data Source Statement: Except for publicly available information, all other data are processed and derived by SMM based on publicly available information, market communication, and SMM’s internal database models, for reference only and not constituting decision-making advice. Scan the code to access information for free
Mar 9, 2026 14:39 - [SMM Hot Topic] Steel Companies' Q3 Reports Show Rising Profits, Significant Improvement for Many
In Q3, domestic economic operations were generally stable, with accelerated industrial upgrading and development of new quality productive forces. New momentum enhanced economic resilience and vitality, leading to steady growth in steel demand from sectors like high-end manufacturing and new energy. The spread between purchase and selling prices saw a slight recovery QoQ. During the reporting period, the domestic steel price index rose 1.8% QoQ from Q2; iron ore prices increased slightly, with the Platts 62% iron ore index up 4.4% QoQ from Q2. Coking coal prices rose sharply, with the Lvliang coking coal price in Shanxi increasing 17.7% QoQ from Q2. However, it is noteworthy that the steel industry remains in a pattern of strong supply and weak demand, with some enterprises still facing operational pressures such as costs being more likely to rise than fall, and transformation and upgrading.
Nov 6, 2025 14:55 - [SMM Holiday Review] Ferrous Metals Prices Fluctuated Rangebound on the First Trading Day After the Holiday, with the Market Operating Smoothly During the Double Holiday Period.
During the National Day & Mid-Autumn holiday, the domestic and overseas steel market operated stably. On the first day after the holiday, spot prices of ferrous metals series fluctuated slightly compared to before the holiday. By product category: Iron ore Imported ore During the National Day holiday, while domestic futures were suspended, the most-traded Singapore iron ore swap contract played a "bellwether" role. Influenced by US non-farm payrolls data, expectations for US Fed interest rate cuts increased, leading to a slight rise during the holiday, with the Platts 62% index increasing by $0.3. In terms of spot cargoes, as steel mills had already stockpiled before the holiday, traders mainly took time off, resulting in almost no transactions at domestic ports. On the first trading day after the holiday, the most-traded iron ore futures contract held up well, with spot prices rising 5-10 yuan/mt. Among them, PB fines spot prices at Qingdao port in Shandong mostly quoted around 780-790 yuan/mt. Considering the expectation for post-holiday restocking by steel mills, and the high likelihood of another US Fed interest rate cut in October, along with two important meetings domestically, macro sentiment is positive, and it is expected that short-term iron ore prices will continue to hold up well. In the medium and long term, the supply-demand imbalance of iron ore is gradually accumulating, which will put significant pressure on ore prices. Domestic ore Compared to pre-holiday, the comprehensive price of domestic iron ore fines dropped back slightly during the holiday, with regional trends diverging. Affected by the adjustment of the Platts index, prices in east China and Handan and Xingtai regions in Hebei fell 15–20 yuan/mt; whereas prices in Qian'an and Zunhua regions in Hebei, as well as in Liaoning, remained stable with limited fluctuations. Fundamentally, the supply of domestic iron ore resources remains tight, and blast furnace operations at steel mills are generally stable, with overall fundamentals changing relatively little. It is expected that some steel mills will have restocking needs in the early days after the holiday, potentially boosting the trading sentiment in the domestic iron ore market; however, subsequent trends still need to be monitored based on the overall contraction of steel mill profits. Overall, it is anticipated that domestic iron ore prices may show a slight upward trend in the days following the holiday. Coke and coking coal During the National Day holiday, the coke market held up well, with mainstream steel mills in Shandong accepting the first round of coke price increases on October 1st, officially implementing a 50 yuan/mt increase for wet quenched coke and a 55 yuan/mt increase for dry quenched coke. Fundamentally, coke production and supply were normal during the National Day holiday. As both coking coal and coke prices rose, the cost of coking increased, reducing coke enterprise profits and restraining the expansion of coke supply. Additionally, during the holiday, downstream purchasing was active, with most coke enterprises selling as they produced, keeping their coke inventories at low levels. Only in some areas, logistics were affected by the holiday and rainy weather, causing some shipping disruptions. On the raw material coking coal front, most coal mines maintained stable production, while individual mines suspended operations for maintenance, resulting in only a slight overall decline in output, which had limited impact on the market. Downstream coke and steel enterprises showed moderate procurement enthusiasm, and the supply-demand imbalance was not yet pronounced, providing some support for coking coal prices. Looking ahead, from a fundamental perspective, coke producers maintained moderate production enthusiasm, and coke supply remained relatively stable. However, most steel mills' coke inventories were at safe levels, and finished product inventories accumulated, leading to generally subdued restocking willingness after the holiday. On the raw material side, the coking coal market performed moderately after the holiday, with slight corrections in prices for some high-grade coal varieties, while most coal prices held steady, thus maintaining cost support for coke. In summary, the coke market is expected to operate steadily in the short term, but further price increases for coke after the holiday will face significant challenges. Construction Steel During the National Day holiday, national spot prices for construction steel traded within a narrow range, with quotations largely stable in most regions, while individual markets saw fluctuations of 10-20 yuan/mt. On the supply side, blast furnace mills mostly maintained pre-holiday production schedules during the break. Except for some mills where variety steel margins were relatively better, leading to a slight shift in hot metal toward variety steel, construction steel output experienced a minor decline. Additionally, although steel scrap prices declined during the holiday, challenges in scrap collection persisted, and losses at electric furnace mills improved only marginally, prompting them to maintain production rhythms focused on off-peak electricity usage in the short term. Inventory-wise, most merchants took 3-4 days off during the holiday, while some arranged for staff to work on other statutory holidays. However, downstream construction sites were largely semi-idle during the break, with slow progress and relatively limited procurement volumes. Arrivals at markets were normal during the holiday, leading to noticeable accumulation in both producer's warehouses and social inventories. Some resources in producer's warehouses had not yet been transferred to the market, resulting in a faster accumulation rate at producer's warehouses compared to social inventories. Looking ahead, price trends may diverge across regions. Specifically, continued heavy rainfall in southern and northern China may still constrain demand release in the first week after the holiday, making it difficult to quickly alleviate inventory pressure and leading to relatively weak stability in spot prices. However, regions such as east China and southwest China may see significant restocking demand from downstream sectors after the holiday. Previously, downstream players adopted a cautious wait-and-see attitude toward the market outlook and basically stocked up as needed before the holiday. As end-users resume normal construction activities after the holiday, this pent-up demand is expected to be gradually released, potentially driving inventory drawdowns and providing some support to the bottom of spot prices. Overall, short-term construction steel prices still have some upside potential, but medium and long-term performance will depend on the realization of demand during the October peak season. Sheets & Plates During the National Day & Mid-Autumn Festival holiday, HRC prices in major national markets remained stable. On the first trading day after the holiday, in the east China market, quotations in Shanghai and Zhangjiagang edged up slightly by 10-20 yuan/mt compared to pre-holiday levels. However, inquiry activity in the market was weak, and end-users showed a strong wait-and-see attitude. In the Ningbo market, spot prices at the tail end of today were quoted at 3,360-3,370 yuan/mt, up 10-20 yuan/mt from pre-holiday levels. Traders actively sold goods, but the market trading atmosphere was moderate, with some end-users showing average purchasing enthusiasm. In the south China market, on the 9th, offers in the Lecong market were 3,330-3,340 yuan/mt, up 10 yuan/mt from pre-holiday levels. Overall trading conditions were moderate, with some end-users conducting restocking; most traders were on holiday during the break, and sales performance was average. In the northern market, on the 9th, overall trading performance of hot-rolled coil (HRC) in mainstream northern markets was average. Among them, spot offers in the Tangshan market were 3,300 yuan/mt, up 20 yuan/mt from pre-holiday levels, with a moderate trading atmosphere and average downstream purchasing initiative; offers in the Shenyang market were 3,320 yuan/mt, up 20 yuan/mt from pre-holiday levels, and HRC trading performance was average. In the cold-rolled market, on the 9th, Bensteel Group's cold-rolled DC01 1.0 in Shanghai was quoted at 3,830 yuan/mt, down slightly by 10 yuan/mt from pre-holiday levels. Market prices fluctuated relatively little compared to pre-holiday, trading was average, with no significant improvement. Looking ahead, on the first day after the holiday, the social inventory of HRC in 86 warehouses nationwide (large sample) as surveyed by SMM totaled 4.0965 million mt, up 457,900 mt MoM, an increase of 12.58% MoM, and down 5.45% YoY. By region, south China and north China saw the largest accumulations, both exceeding 15%, while east China, central China, and north-east China had accumulations below 10%. Social inventory accumulated significantly nationwide during the holiday, with the accumulation rate higher than the same period last year, and inventory levels approaching last year's. Attention will be paid to the start of demand and inventory destocking speed in the first one to two weeks after the holiday. In the short term, HRC prices are expected to fluctuate within a weak range, with focus on the most-traded contract range of 3,230-3,330 yuan. Export and Overseas Markets During China's National Day holiday, most domestic export traders were on holiday and stopped offering quotes. Today is the first working day after the holiday. In terms of export offers, FOB prices for sheets & plates remained stable compared to pre-holiday levels, while long product prices saw a slight decrease MoM. In terms of export order-taking, market inquiries were not active today, and overall trading was weak. Regarding the new income tax payment announcement effective from October 1, which had attracted widespread attention previously, according to SMM surveys, there have been no new implementation progress reports at northern ports currently. MD quotes seem to be emerging again, while southern ports continue to mainly handle tax-included exports due to more complicated procedures. SMM will continue to monitor further developments. On October 7, the EU officially announced the strictest steel import ban in history, reducing the duty-free import quota to 18.3 million mt per year, down 47% from 2024; the tariff rate for excess steel import products increased from 25% to 50%; simultaneously, new traceability requirements for origin (smelting and pouring) were added. The bill aims to replace the steel safeguard measures set to expire in June 2026 and may be implemented by July 1, 2026, at the latest. While the actual impact cannot be estimated for now, barriers facing Chinese steel products exported to the EU are expected to increase. In major global markets, Chinese traders maintained stable export offers. During the National Day holiday, market sales enthusiasm was weak. Indian market sentiment remained sluggish, with weak demand for finished products. Due to the impact of the Dussehra holiday (October 2), trader procurement activities slowed down, and steel prices remained in the doldrums. Russia's Ministry of Finance postponed tax payment deadlines for metallurgical enterprises, including the indexation of the steel excise tax and an increase in its zero threshold, as well as exempting electric furnace metallurgical enterprises from this tax. Steel prices temporarily stabilized, with expectations of future increases. Southeast Asian prices followed fluctuations in the Chinese market, with pre-holiday declines being slightly larger, falling by $3–5/mt, and market transactions were weak. Japan's Daiwa Steel plans to upgrade its section steel rolling mill, expected to be completed by summer 2028. Market traders, considering the short-term supply contraction due to equipment upgrades, have slightly raised steel prices. The European Commission has confirmed a proposal to halve quotas and impose a 50% tariff, leading to rising import prices. Due to increased barrier risks, imported resources have sharply decreased. Overview of Important Holiday News [EU Plans to Impose 50% Tariff on Extra-Quota Steel Imports] On the 7th, the EU announced steel import restriction measures, proposing to significantly reduce the quota for steel imports eligible for tariff exemptions and raising the steel tariff from 25% to 50%. According to the announcement issued by the European Commission that day, the EU plans to set the annual steel import quota at 18.3 million mt, a 47% reduction compared to the 2024 steel import quota. For steel imports beyond the quota, the EU intends to impose a 50% tariff, doubling the current 25% tariff. The announcement also indicated that the EU will take measures to strengthen origin tracing for melted and cast steel products to prevent so-called "circumvention" practices. The announcement stated that the EU's move aims to address the negative impacts of global steel overcapacity and ensure the long-term development of the EU steel industry as a strategic sector. According to the EU agenda, after the European Commission announced the restriction measures on the 7th, the European Parliament and the Council of the EU will conduct reviews. If approved, these measures will take effect after the current EU measures expire in June 2026. [BHP Accepts Yuan Settlement Requirement!] In October 2025, BHP accepted the yuan settlement requirement for some iron ore trades with Chinese customers. This resulted from China's concentrated procurement strategy and market forces, marking a breakthrough for the yuan in commodity settlement. BHP, after multiple rounds of negotiations with China Mineral Resources Group (CMRG) and related steel enterprises, officially implemented yuan-denominated settlements starting in Q4 2025. The scope of coverage includes: Remaining spot cargoes: accounting for approximately 30% of BHP's total iron ore exports to China (long-term contracts continue to be priced in US dollars, but an "observation period" has been established; if the market acceptance of China's iron ore index, such as the Northern Iron Ore Index, meets the standard by 2026, negotiations for yuan-denominated settlements of long-term contracts may be initiated); Port spot cargoes and CFR transactions: for spot iron ore at Chinese ports, yuan-denominated CFR settlements are adopted, mitigating the impact of US dollar exchange rate fluctuations on enterprise costs. [EU to Cut Import Quotas for Flat Products by 8.5 Million mt] On October 7, the EU announced it would reduce import quotas for flat products by 8.5 million mt. The import cap for hot-rolled coil (HRC) will be 5.2 million mt, the quota for cold-rolled coil will be 1.5 million mt per year, and the quota for hot-dip galvanized products will be 2.85 million mt per year. Quotas will be allocated quarterly, with unused amounts not carried over. All countries, including Ukraine, will be subject to the new measures, meaning any imports exceeding these levels will face a 50% tariff, although the tariff will still be calculated proportionally at the start of the new quota period. [Six Departments Jointly Issue the "Work Plan for Stabilizing Growth in the Machinery Industry (2025-2026)"] Recently, six departments including the Ministry of Industry and Information Technology jointly issued the "Work Plan for Stabilizing Growth in the Machinery Industry (2025-2026)". It proposes that the average annual revenue growth rate of the machinery industry should reach around 3.5% during 2025-2026, with revenues exceeding 10 trillion yuan by 2026, and aims to cultivate a number of competitive characteristic industrial clusters of small and medium-sized enterprises and internationally competitive industrial clusters. [Loudi, Hunan to Add a 5 Billion Yuan Silicon Steel Project] Loudi, Hunan, aiming to build a "Material Valley" in central China and focusing on the "three steels, three electricals, and one titanium" industry chain, has attracted over 80 projects each with investment exceeding 100 million yuan, totaling 36.839 billion yuan in investment. Local enterprises' technological transformation and expansion investments exceeded 10 billion yuan, with Hongwang Group adding a 5 billion yuan silicon steel and titanium materials industry chain project. Since the beginning of this year, Loudi City has thoroughly implemented the decisions and deployments of the CPC Central Committee and the State Council on promoting the development of the private economy. Through three core measures—policy empowerment, industrial concentration, and service efficiency enhancement—the city has promoted high-quality development of private investment. From January to August, the city's private investment grew by 9.1%, with the growth rate ranking among the top in the province, and five enterprises from Loudi were listed among China's Top 500 Private Enterprises. [Fatal Accident at Winning Consortium Simandou (WCS) Iron Ore Project in Simandou, Guinea] A fatal accident occurred at Blocks 1 and 2 of the Winning Consortium Simandou (WCS) iron ore project in Simandou, Guinea, resulting in the deaths of three foreign workers. The project has suspended operations and initiated a comprehensive safety review. This is the second work stoppage at the Simandou mine due to an accident in less than two months. [Hainan: Suspension of Hainan Province's 2025 Vehicle Replacement and Renewal Subsidy Policy Effective October 6] The Hainan Provincial Department of Commerce issued an "Announcement on Further Adjusting Relevant Matters of the 2025 Trade-in Policy for Consumer Goods in the Commercial Sector" on October 4. The announcement stated that the 2025 Hainan Province Vehicle Replacement and Renewal Subsidy Policy will be suspended starting from 00:00 on October 6, 2025. Consumers whose new vehicle "Motor Vehicle Sales Uniform Invoice" was issued before 00:00 on October 6, 2025, can apply for the subsidy as normal; subsidy applications for invoices issued on or after 00:00 October 6 will no longer be accepted. Eligible consumers should submit their applications and upload the required documents via the "2025 Hainan Province Vehicle Replacement and Renewal Subsidy Application Platform" before 24:00 on October 31, 2025; any supplementary information must be completed by 24:00 on November 15, 2025. Failure to submit or supplement information by the deadline will be deemed an automatic waiver of the subsidy eligibility. The announcement stated that subsidies for products such as home appliances, home furnishings, mobile phones, and digital products will continue to be implemented according to the current policy. The vehicle retirement and renewal, and e-bike trade-in subsidy policies remain unchanged. [Vietnam's Capital Hanoi Paralyzed by Heavy Rain Again Within Two Weeks, Triggering Flood Warnings in Multiple Areas] Vietnam's national meteorological agency has issued flash flood warnings for 13 provinces, including Thanh Hoa, Hai Phong, and Bac Ninh. Among them, Bac Ninh is an important manufacturing hub for global electronics suppliers that produce products for companies like Apple and Samsung Electronics. This storm comes one week after Typhoon Bualoi swept through northern Vietnam, causing at least 56 deaths and estimated economic losses of 18.8 trillion Vietnamese dong. Bualoi was the 10th tropical storm to make landfall in Vietnam this year. The meteorological agency predicts that up to four typhoons or tropical depression systems may enter the South China Sea before the end of the year, with one or two potentially affecting Vietnam. [Egypt Launches New Incentive Plan to Support the Steel Industry] Egypt's Ministry of Industry announced the launch of a new incentive package to revitalize industrial growth, with a focus on supporting strategic steel enterprises. The plan includes priority access to competitively priced industrial land, flexible payment terms, loans for working capital and production lines, 24-hour fast-track licensing, and accelerated provision of supporting infrastructure. The Egyptian government aims to reduce import dependency, expand domestic capacity, and establish Egypt as a regional steel export hub. The incentive program offers a series of preferential policies designed to attract and retain industrial investors. Data Source Statement: Except for publicly available information, all other data are processed by SMM based on public information, market communication, and SMM's internal database model, and are for reference only, not constituting decision-making advice. Note: This article is an original work of this official account. For requirements such as reprinting, reprinting authorization, or cooperation, please contact us. Without permission, it is prohibited to reprint, modify, use, sell, transfer, display, translate, compile, disseminate, or disclose the above content to third parties in any other form, or permit third parties to use it. Otherwise, once discovered, SMM will pursue legal action against infringement, including but not limited to claiming contractual breach liability, restitution of unjust enrichment, and compensation for direct and indirect economic losses.
Oct 9, 2025 16:20 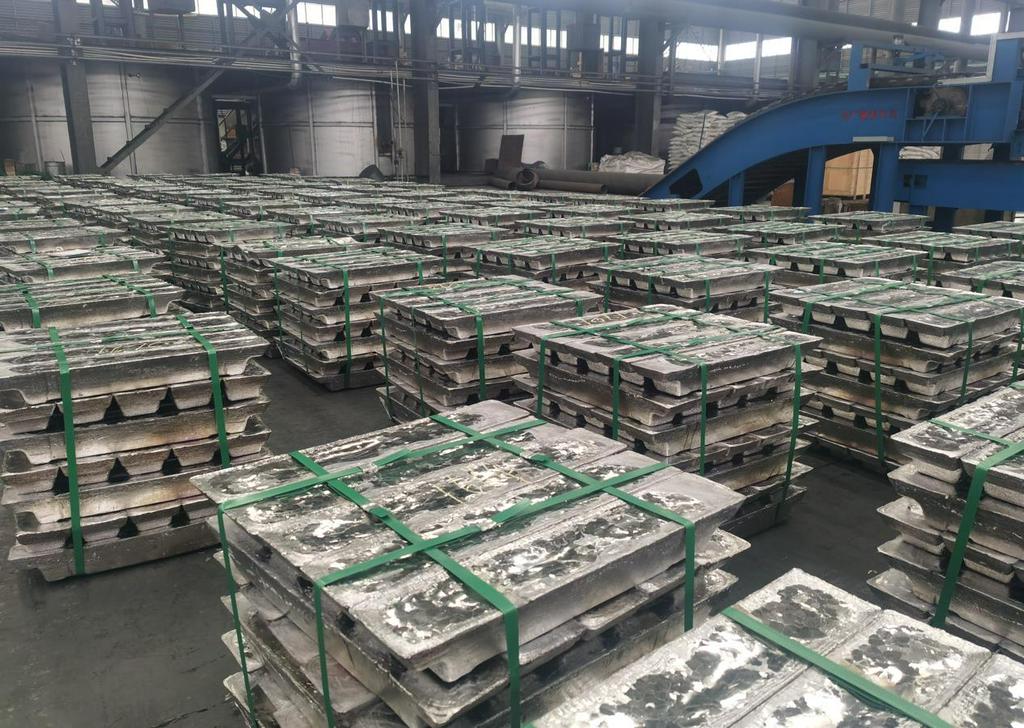 H1 2025: World primary aluminium output grows despite market headwinds, with China and emerging regions driving gains
The world primary aluminium production seems to have withstood all the recent hurdles like escalating trade tensions, raw material costs, and supply chain disruptions with a decent growth rate of 1.4 per cent year-on-year in the second quarter of 2025.
Jul 29, 2025 10:14
Loaded to the end