- [SMM Hot Topic] Weak Domestic Demand + Export Diversion Cool the “North-to-South Steel Flow”
As supply and demand for construction steel were not fully matched across different markets, regional supply-demand mismatches created price differentiation, which in turn drove the cross-regional circulation of steel resources. When the regional price spread gradient was appropriate, regions with surplus construction steel capacity and production often shipped excess resources out, thereby rebalancing construction steel resources across regions.
Mar 24, 2026 15:54 - [SMM Analysis] March Pr-Nd Drop Likely Due to Weak Demand Outlook: 2026 Demand Model (Part 2)
SMM News: Following our previous analysis of the transportation and wind power sectors, this installment shifts focus to the critical demand drivers in the consumer and construction domains: White Goods , Consumer Electronics , and Real Estate-related applications (Elevators and Power Tools). While these sectors individually consume less magnetic material per unit compared to New Energy Vehicles (NEVs), their sheer aggregate volume makes them indispensable pillars of the Neodymium-Praseodymium (Pr-Nd) market. However, data from early 2026 reveals a troubling trend of stagnation and structural contraction across these traditional strongholds. I. White Goods: The Dual Pressure of Production Slumps and Material Substitution In the white goods sector, Neodymium-Iron-Boron (NdFeB) magnets are primarily utilized in two key applications: compressors for inverter air conditioners and motors for drum and impeller washing machines . 1. Air Conditioners: A Sharp Contraction in Output and Dosage According to data from the National Bureau of Statistics (NBS), China’s cumulative air conditioner production for January-February 2026 stood at 40.118 million units , a staggering 35% year-on-year (YoY) decline compared to the 61.921 million units produced in the same period of 2025. (Reason: This drastic drop is attributed to a combination of factors: firstly, an unusually mild winter across major consumption regions significantly dampened heating demand, leading to a destocking cycle among distributors. Secondly, the real estate sector’s continued downturn has severely curtailed new housing completions, directly reducing the installation of centralized and split AC systems. Lastly, high inventory levels carried over from 2025 forced manufacturers to aggressively cut production schedules in Q1 2026 to avoid capital lock-up.) Looking at the full year, SMM forecasts a marginal growth of 0.96% for 2026, with total annual production projected at 271.095 million units . (Reason: The near-flat growth outlook reflects a mature market saturation where replacement demand, rather than new installations, drives volume. While export markets offer some resilience against domestic weakness, rising trade barriers and logistical costs in key regions like Europe and North America are expected to cap significant expansion.) Applying SMM’s calculation model: Inverter Penetration: 99% NdFeB Motor Penetration: 92% Specific Consumption: Assumed at 100g/unit for 2026. Based on these parameters, the total NdFeB consumption for the air conditioner sector in 2026 is estimated at 24,691 tons , representing a 23% decrease from the 29,163 tons consumed in 2025. The core driver of this decline is twofold: first, the persistently high prices of Pr-Nd since the second half of 2025 have accelerated the industry’s cost-reduction initiatives. Second, there is a clear technological shift towards minimizing rare earth usage. The average single-unit dosage has dropped from 120g/unit in 2025 to 100g/unit in 2026 , as manufacturers optimize motor designs and, in some lower-end models, substitute with ferrite magnets or induction motor technologies where efficiency standards allow. 2. Washing Machines: A Slow Erosion of Demand For January-February 2026, China’s cumulative washing machine production was 18.58 million units , a slight 0.3% YoY decline from the 18.51 million units in the same period of 2025. (Reason: The stability in production volumes masks underlying weakness. The slight dip is primarily due to weak consumer confidence impacting discretionary spending on home appliance upgrades. Furthermore, the export market for washing machines has faced headwinds from sluggish global economic growth and intensified competition from Southeast Asian manufacturing hubs, offsetting modest domestic recovery efforts.) SMM projects a full-year growth rate of 3.1% for 2026. (Reason: This modest recovery is underpinned by government-led "trade-in" subsidy policies aimed at boosting domestic consumption of energy-efficient appliances. Additionally, product innovation in the high-end segment, such as washer-dryer combos and smart features, is expected to stimulate some replacement demand, though the overall ceiling remains low.) Demand Calculation Logic: Drum Washer Penetration: 63% (High-end, 98% use NdFeB) Impeller Washer Penetration: 28% (Mid-range, 50% use NdFeB) Specific Consumption: 290g/unit for drum washers; 240g/unit for impeller washers. Under this model, the total NdFeB demand for washing machines in 2026 is estimated at 27,204.52 tons , a 0.2% decrease from 27,262 tons in 2025. The sector is experiencing a slow but steady erosion of demand. While high-end drum washers rely heavily on efficient NdFeB motors to meet stringent energy labels, the volatility of rare earth prices is prompting manufacturers to cautiously explore alternative motor designs or reduce magnet grades in non-critical applications. Consequently, the industry has adopted a strategy of gradual reduction rather than abrupt substitution, balancing performance requirements with cost control. Outlook: The trajectory for white goods in 2026 is undeniably pessimistic. Both production volumes and technical intensity (dosage per unit) are trending downward, creating a double drag on Pr-Nd demand. II. Consumer Electronics: Volume Resilience vs. Intensity Decline The consumer electronics sector, modeled by SMM, comprises four main segments: Mobile Phones , Tablets , Desktops/Laptops , and Smartwatches . These devices utilize NdFeB primarily for acoustic components (speakers/receivers) and haptic feedback motors, with emerging uses in magnetic charging interfaces. The specific consumption is generally low, ranging from 2-5g/unit , except for desktops which average 15g/unit . Market Performance (Jan-Feb 2026): Mobile Phones: 220 million units (+6.8% YoY). Micro-computer Equipment: 41.956 million units (-31% YoY). Breakdown: 21% Tablets, 27% Desktops, 52% Laptops. Smartwatches: 8.196 million units (+7.8% YoY). (Reason: The divergence in performance is stark. Mobile phone growth is driven by the global rollout of AI-enabled handsets and the replacement cycle for 5G devices, particularly in emerging markets. Conversely, the sharp collapse in micro-computer equipment reflects the post-pandemic normalization of demand; the massive stockpiling of devices during 2020-2022 has led to a prolonged digestion phase. Additionally, extended device lifespans due to improved hardware durability have further suppressed replacement rates for PCs and tablets.) 2026 Full-Year Forecast: SMM anticipates a 1% growth for mobile phones and micro-computers combined, and a 5% growth for smartwatches. (Reason: The muted outlook for computing devices stems from persistent macroeconomic uncertainty and corporate IT budget tightening. For smartwatches, growth is fueled by increasing health-monitoring capabilities and deeper ecosystem integration with smartphones. However, the entire sector faces a cloud of uncertainty due to escalating geopolitical tensions affecting supply chains and rising memory chip prices, which may force OEMs to revise production targets downward later in the year.) Demand Estimation: Mobile Phones: 3,109.8 tons Micro-computers: 2,018.9 tons Smartwatches: 125.06 tons Total 2026 Demand: 5,253.76 tons , a 3% decline from 5,421.19 tons in 2025. The primary driver for this decline is the continuous, albeit slow, reduction in specific consumption. As miniaturization advances and alternative magnetic materials improve, the amount of NdFeB required per device is shrinking. Despite the relatively low single-unit dosage, the massive scale of the consumer electronics industry ensures it remains a significant consumer of NdFeB. Moreover, this sector is characterized by highly standardized supply chains, where major OEMs maintain binding agreements with certified magnet suppliers, making demand relatively stable but resistant to price-driven spikes. III. Real Estate Related: Elevators and Power Tools The final segment covers industries tightly coupled with the real estate cycle: Elevators and Handheld Power Tools . 1. Elevators: Policy Support vs. Structural Headwinds In January-February 2026, elevator production reached 150,000 units , a 7.1% YoY increase . (Reason: This short-term surge is largely attributable to the acceleration of projects that were delayed in late 2025, as developers rushed to meet pre-delivery deadlines before stricter regulatory inspections took effect. Additionally, government mandates for retrofitting old residential communities with elevators in urban renewal zones provided a temporary boost to order books.) However, SMM forecasts a full-year contraction of -3% for 2026. (Reason: The long-term outlook is grim due to the fundamental slowdown in new residential construction starts, which remain at multi-year lows. The debt crisis plaguing major property developers continues to stall new project launches, directly impacting the demand for new elevator installations. While the retrofit market offers some support, it is insufficient to offset the collapse in new building commissions.) Calculation: Energy-saving Elevator Penetration: 90% Specific Consumption: 6 kg/unit (for energy-saving models). Total 2026 Demand: 7,222.6 tons , a 1.3% increase from 7,125.3 tons in 2025. (Reason for Growth: The slight increase in total tonnage despite falling production volumes is entirely driven by the rising penetration of energy-saving elevators. Stricter national energy efficiency standards (GB standards) are forcing manufacturers to adopt permanent magnet synchronous motors (PMSM) over traditional asynchronous motors, thereby increasing the average NdFeB dosage per unit even as the total number of units declines.) 2. Handheld Power Tools: A Direct Casualty of Property Slump Production of handheld power tools in Jan-Feb 2026 was 29.566 million units , down 0.24% YoY . SMM projects a -3% decline for the full year 2026. (Reason: The downturn is inextricably linked to the stagnation in the global and domestic real estate markets. Reduced renovation activities and a slowdown in infrastructure projects have dampened demand for professional-grade tools. Furthermore, high inventory levels in distribution channels across North America and Europe, resulting from over-ordering in 2024, have led to a prolonged period of destocking.) Definition & Scope: According to the National Bureau of Statistics, handheld electric tools refer to portable motor-driven tools operated by hand, including electric drills, grinders, sanders, saws, and screwdrivers . These products are highly sensitive to housing turnover and renovation rates. Demand Calculation: NdFeB Penetration: 60% Specific Consumption: 80g/unit Total 2026 Demand: 9,134 tons , a sharp 13.4% drop from 10,548 tons in 2025. The significant contraction in this sector underscores the deep correlation between the property market and industrial metal demand. As the real estate sector remains in a prolonged adjustment phase, the downstream demand for power tools—and consequently NdFeB—faces sustained pressure. Conclusion The analysis of white goods, consumer electronics, and real estate-related sectors paints a picture of structural weakness for 2026. While niche policy drivers (like energy-saving elevator mandates) provide isolated pockets of growth, the overarching trends are defined by production saturation, inventory destocking, and aggressive material substitution . The combined effect of lower production volumes and reduced single-unit dosages creates a formidable headwind for Pr-Nd prices. In the final installment of this series, we will pivot to the future: examining the burgeoning demand from Low-Altitude Economy (eVTOLs), Robotics (Industrial and Service), and the relentless expansion of Electric Two-Wheelers . These emerging sectors may hold the key to offsetting the declines observed in traditional industries and reshaping the long-term demand curve for rare earth magnets.
Mar 23, 2026 23:33 - How low could gold go?
“Gold’s status as a haven may now be tarnished in the eyes of some as the precious metal is falling in price even as war roils the Middle East and financial markets alike, and some may even be tempted to say that the third major bull run in the commodity since 1971 is now over,” says AJ Bell investment director Russ Mould.
Mar 23, 2026 09:43 - China's Aluminum Processing Sector Sees Modest Growth Amid Peak Season Demand
[Weekly Operating Rates in the Aluminum Processing Industry: China's Aluminum Processing Sector Sees Modest Growth Amid Peak Season Demand] This week, the weekly operating rate of leading downstream aluminum processing enterprises in China edged up 1 percentage point WoW to 62.9%.
Mar 20, 2026 09:49 - Cost-Driven Titanium Dioxide Price Increases Took Effect, Market Price Adjustments Released Upward Signals [SMM Titanium Weekly Review]
[SMM Titanium Weekly Review: Cost-Driven Titanium Dioxide Price Hikes Took Effect, Market Adjustments Released Upward Signals] This week, the titanium industry chain showed a divergent trend. The titanium concentrate market remained in the doldrums, with imported ore prices falling लगातार under pressure from downstream efforts to push for lower prices and accumulating port inventory. Titanium dioxide, meanwhile, saw the second round of collective price adjustments in mid-month under persistently high sulphuric acid costs. Mainstream enterprises in China raised domestic prices by 500 yuan/mt and export prices by $100/mt, pushing the quoted center up to 14,000-14,500 yuan/mt, though follow-up from domestic demand remained mediocre and foreign trade orders showed clear divergence. The titanium slag market stayed in the doldrums, with prices under pressure amid weak costs and demand. In the titanium sponge market, leading enterprises took the lead in raising prices, with domestic prices up 2,000 yuan/mt and international prices up $300/mt. Supported by restocking demand for titanium materials and low inventory, the market showed a strong willingness to hold prices firm, but downstream processing segments still maintained a wait-and-see stance, and titanium ingot and titanium plate/strip prices only edged up slightly. Overall, cost support and structural demand divergence coexisted, and future price trends still depended on substantive improvement on the supply and demand side.
Mar 20, 2026 17:58 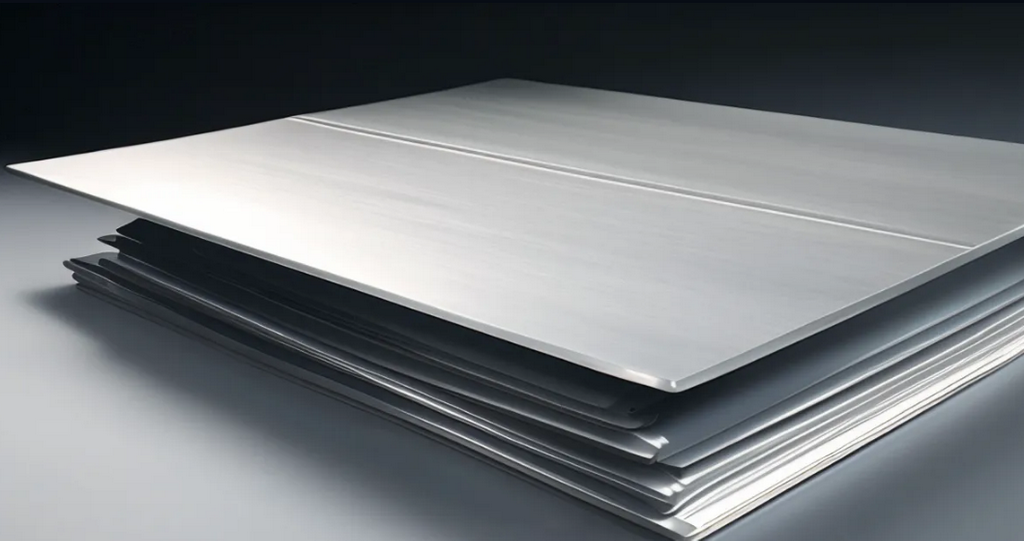 Middle East Conflict & Trade Barriers Disrupt China's Aluminum Plate/Sheet, Strip, and Foil Exports
Among them, the Gulf region was an important consumer market for China in the Middle East: China’s exports of aluminum plate/sheet and strip to Saudi Arabia reached 42,500 mt, and aluminum foil 58,000 mt; exports of aluminum plate/sheet and strip to the UAE reached 103,500 mt, and aluminum foil 93,800 mt; the other four countries (Bahrain, Qatar, Kuwait, and Oman) accounted for combined exports of about 22,000 mt of aluminum plate/sheet and strip and about 11,000 mt of aluminum foil.
Mar 14, 2026 17:35![Aluminum Downstream Operating Rates Rebound to 61.9%; High Prices Challenge "Golden March" Peak Season [SMM Survey]](https://imgqn.smm.cn/usercenter/tXCfs20251217171653.jpg) Aluminum Downstream Operating Rates Rebound to 61.9%; High Prices Challenge "Golden March" Peak Season [SMM Survey]
Aluminum Downstream Operating Rates Rebound to 61.9%; High Prices Challenge "Golden March" Peak Season [SMM Survey][SMM Weekly Survey of the Aluminum Downstream Sector: Downstream Aluminum Operating Rate Continued to Rebound to 61.9%, with High Prices Suppressing the Peak "Golden March" Season] This week, the weekly operating rate of leading downstream aluminum processing enterprises in China rose 2.4 percentage points MoM to 61.9%, overall extending the post-holiday recovery trend, with all segments rebounding MoM, and the industry as a whole entering a normal production pace.
Mar 12, 2026 22:49- The export of galvanized sheets reached a nearly four-year high in March [SMM analysis]
According to the latest customs data, China’s export volume of galvanized sheets in March 2024 was 1.2003 million tons, a month-on-month increase of 43.83%, and a year-on-year increase of 25.41%; the cumulative export volume from January to March 2024 was 2.964 million tons, a year-on-year increase of 19%.
Apr 24, 2024 17:17 - [SMM Analysis] Freight Rates Surge, Making Deals Difficult for Steel Exporters
[SMM Analysis] Freight Rates Surge, Making Deals Difficult for Steel Expor ters Affected by the US-Iran conflict, tight energy supply and sharply higher fuel costs, compounded by exchange rate fluctuations, have continuously pushed up China's export offers in recent days. Compared with the beginning of the month (March 6), SMM HRC prices have been raised by $9/mt; galvanizing prices rose by $11/mt; CRC rose by $5/mt; billet rose by $6/mt; and rebar rose by $6/mt. However, looking back at market transaction performance, deals weakened again recently. According to the SMM survey, ocean freight rates surged sharply, with current freight to the Middle East as high as $50-60. Most outside China clients remained on the sidelines; shipowners also refused to commit tonnage while waiting for the market to stabilize. For China exporters, there were offers but no market, making shipments difficult. Meanwhile, market sources said Hadeed, the GCC's only flat steel producer, raised its May hot-rolled coil (HRC) prices, still related to shipping restrictions in the Strait of Hormuz. HRC cargoes previously booked from China and other origins were also being redirected to the west coast, mainly heading to Jeddah Port, bringing high inland transportation costs. As for global steel prices, in India, in addition to rising raw material costs and rupee depreciation, a sudden LNG energy shortage further pushed up production costs, forcing steel mills to maintain a strong willingness to hold prices firm despite the traditional domestic off-season and blocked exports. In the Southeast Asian market, price increases were accepted entirely passively, mainly due to the rigid pass-through of high ocean freight rates by overseas suppliers. Although Southeast Asian buyers hesitated to take orders, they had no choice but to passively accept the increases against the backdrop of persistently high geopolitical logistics costs. At the same time, CIS export offers also rose significantly, benefiting from the intensifying geopolitical conflict in the Middle East and the resulting short-term global supply tightens. In the Middle East market, meanwhile, as war tensions continued to escalate, the closure of the Strait of Hormuz completely disrupted transportation, while freight rates and delivery uncertainty pushed the sheets & plates import markets in the UAE and Saudi Arabia into a complete standstill. Copyright and Intellectual Property Statement: This report is independently created or compiled by SMM Information & Technology Co., Ltd. (hereinafter referred to as "SMM"), and SMM legally enjoys complete copyright and related intellectual property rights. The copyright, trademark rights, domain name rights, commercial data information property rights, and other related intellectual property rights of all content contained in this report (including but not limited to information, articles, data, charts, pictures, audio, video, logos, advertisements, trademarks, trade names, domain names, layout designs, etc.) are owned or held by SMM or its related right holders. The above rights are strictly protected by relevant laws and regulations of the People's Republic of China, such as the Copyright Law of the People's Republic of China, the Trademark Law of the People's Republic of China, and the Anti-Unfair Competition Law of the People's Republic of China, as well as applicable international treaties. Without prior written authorization from SMM, no institution or individual may: 1. Use all or part of this report in any form (including but not limited to reprinting, modifying, selling, transferring, displaying, translating, compiling, disseminating); 2. Disclose the content of this report to any third party; 3. License or authorize any third party to use the content of this report; 4. For any unauthorized use, SMM will legally pursue the legal responsibilities of the infringer, demanding that they bear legal responsibilities including but not limited to contractual breach liability, returning unjust enrichment, and compensating for direct and indirect economic losses. Data Source Statement: (Except for publicly available information, other data in this report are derived from publicly available information (including but not limited to industry news, seminars, exhibitions, corporate financial reports, brokerage reports, data from the National Bureau of Statistics, customs import and export data, various data published by major associations and institutions, etc.), market exchanges, and comprehensive analysis and reasonable inferences made by the research team based on SMM's internal database models. This information is for reference only and does not constitute decision-making advice. SMM reserves the final interpretation right of the terms in this statement and the right to adjust and modify the content of the statement according to actual circumstances.
Mar 17, 2026 15:28 - Post-Holiday Demand Continues to Recover; March Copper Plate/Sheet and Strip Operating Expectations Improve
According to SMM, the operating rate of the copper plate/sheet and strip industry was 41.98% in February 2026, down 28.04 percentage points MoM and down 14.49 percentage points YoY. Among them, the operating rate of large enterprises was 47.35%, that of medium-sized enterprises was 35.28%, and that of small enterprises was 31.80%.
Mar 9, 2026 14:23