

- Singapore, Hong Kong take rival paths to capture global gold trade
Published: 5 days ago One builds MAS-backed vaulting for central banks, the other opens a pipeline to Shanghai. Singapore and Hong Kong are pursuing different strategies to bolster their positions as precious metals hubs , with Singapore expanding clearing and vaulting services for international investors and Hong Kong building on its ties to Mainland China's bullion market. Singapore is viewed as a neutral jurisdiction with established storage facilities and a strong wealth management sector, Dick Poon, general manager at Heraeus Precious Metals Hong Kong, said in an emailed reply to questions. He said Hong Kong's advantage lies in its connection with Mainland China's bullion market through its integration with the Shanghai Gold Exchange. Singapore's strategy gathered pace in June when Deputy Prime Minister and Monetary Authority of Singapore Chairman Gan Kim Yong announced at the Asia-Pacific Precious Metals Conference that Singapore Exchange Ltd. would launch an over-the-counter clearing system for Loco Singapore gold by the end of 2026. The system will clear physical gold stored and settled in Singapore and will be backed by DBS Bank Ltd., Deutsche Bank AG, ICBC Standard Bank Plc, JPMorgan Chase & Co., Oversea-Chinese Banking Corp. Ltd., and United Overseas Bank Ltd. Gan also said the Monetary Authority of Singapore would begin offering gold vaulting services to foreign central banks and sovereign entities from October 2026. Singapore will remove the 5% cap on physical investment precious metals under selected tax incentive schemes for eligible funds and single-family offices, whilst Singapore Exchange is studying a physically deliverable gold futures contract. Joshua Rotbart, founder of J. Rotbart & Co., said regulations are no longer the main factor separating Singapore and Hong Kong. "The regulations are almost the same," he told Singapore Business Review via Zoom. "It's more about the nature of the market and the perception of risk." He said investors typically choose Singapore for long-term gold storage and wealth preservation , whilst Hong Kong has developed into a trading centre serving Mainland China. Singapore's latest measures build on work launched in March, when the Monetary Authority of Singapore and the Singapore Bullion Market Association formed the Gold Market Development Working Group to review clearing, settlement, storage, logistics, custody, and investment products. Hong Kong has also stepped up efforts this year, but with a stronger focus on the mainland. The Financial Services and the Treasury Bureau (FSTB) signed a cooperation agreement with the Shanghai Gold Exchange in January to develop a gold central clearing system and deepen cooperation between the two markets. The government also plans to expand Hong Kong's gold storage capacity to more than 2,000 tonnes within three years. The state-owned Hong Kong Precious Metals Central Clearing Company Ltd. held its first board meeting in April. Financial Services and Treasury Secretary Christopher Hui said preparations for the clearing system were progressing, with trial operations scheduled to begin this year. The bureau also announced in June that the Shanghai Gold Exchange had opened its first International Board-certified offshore gold delivery vault in Hong Kong, letting international investors take delivery of eligible contracts outside Mainland China. Albert Cheng, CEO at the Singapore Bullion Market Association, said Project Lion 2 aims to strengthen Singapore's gold market through improvements to clearing, storage, custody, and investment products. "By strengthening clearing, custody, vaulting, and product development, we can complement existing centres and deepen institutional participation," he added. Source: https://sbr.com.sg/exclusive/singapore-hong-kong-take-rival-paths-capture-global-gold-trade
Jul 5, 2026 22:37 - Gold Price in 2026: New Market Structure Paves the Way for a Rise to $4,920
June 8, 2026 Increased mine production, rising recycling, but declining overall demand—at first glance, not a typical environment for new price records. Nevertheless, the experts at Metals Focus forecast an average gold price of $4,920 per ounce for 2026, representing a 43 percent increase from the previous year. This apparent contradiction stems from a profound structural shift in the gold market that has far-reaching implications for the industry. Bullion and coins overtake gold jewelry for the first time The most significant change is taking place on the demand side: In 2026, physical investments in bullion and coins are expected to replace gold jewelry as the largest source of demand for the first time. This trend was already emerging in 2025, when physical investment demand climbed 16 percent to a twelve-year high—driven primarily by growth in China (up 28 percent) and India (up 17 percent). At the same time, global jewelry production plummeted by 19 percent to a five-year low of 1,646 tons. For 2026, Metals Focus anticipates a further decline of 11 percent. The historically high price level is forcing consumers and manufacturers to opt for lighter pieces, lower karat grades, or more affordable alternatives such as gold-filled materials. Consequently, gold is not disappearing from demand but is shifting its primary function from a consumer good to a pure investment product. Unlike jewelry purchases, this investment demand is far less price-sensitive and is primarily driven by motives such as asset protection, diversification, and hedging against currency risks and uncertainties. Lower overall demand—but a higher gold price Although overall demand is expected to decline in 2026 due in part to a slowdown in the jewelry sector, the high quality of buyers supports the projected price surge. Simply looking at total tonnage falls short in the current environment. As early as 2025, gold-backed exchange-traded products (ETFs) recorded their highest annual inflows since 2020, at 803 tons. The driving forces behind this were tariffs, growing U.S. government debt, doubts about the Federal Reserve’s monetary policy independence, and geopolitical tensions. These factors will persist in 2026 and will be exacerbated by high stock market valuations and uncertainties regarding the long-term trajectory of the U.S. dollar. The precious metal is thus assuming an increasingly strategic role in investment portfolios. Central banks are buying less—but still at unusually high levels This strategic importance is also reflected in the behavior of central banks. Although net purchases fell by 22 percent to 848 tons in 2025, after having exceeded the 1,000-ton mark for three consecutive years, geographically broad-based demand remains well above pre-2022 levels. Sales were limited to a few countries and served primarily to rebalance portfolios following the recent gold rally. Despite headwinds such as the ongoing energy crisis, Metals Focus expects historically high net purchases in 2026 as well. While the pace of buying is slowing, the trend toward greater diversification of official reserves remains intact. Gold mines are producing more—but supply is slow to respond On the supply side, global mine production reached a new record of 3,817 tons (up 2 percent) in 2025. Growth was driven by new mines, expansions, and higher contributions from small-scale mining. A further increase of 2.4 percent to 3,907 tons is forecast for 2026, with all regions except Oceania and Europe expected to grow. Given the enormous price surge, this supply growth is nevertheless moderate and underscores that even strong price signals in the mining industry do not immediately lead to massive jumps in production. Compounding the issue is the fact that producers are grappling with significant cost increases: Global all-in sustaining costs (AISC) rose by 12 percent to $1,552 per ounce in 2025 due to inflation and taxes. For junior companies, this means that while a higher gold price improves the profitability of projects, factors such as grade, location, and infrastructure are increasingly decisive for success in light of cost trends. Why even record prices are barely triggering a recycling wave The supply of recycled gold is also responding sluggishly. In 2025, the volume rose by only 2.8 percent to 1,404 tons—a 13-year high that is, however, subdued relative to price trends. A 5.1 percent increase is forecast for 2026. This apparent contradiction can be explained by owners’ strong desire for security: precisely because of prevailing uncertainties, scrap gold is being sold less frequently. Paradoxically, the very factor driving prices is simultaneously limiting the additional supply that would normally cool the market. The Iran War Delays the Next Uptrend Short-term volatility remains a factor, however. Following new record highs at the start of 2026, a previously overbought market combined with shifting U.S. interest rate expectations led to a correction. The war in Iran is further fueling inflation, which limits the scope for interest rate cuts in the U.S. and drives up bond yields. In the short term, this is a headwind for gold, although geopolitical conflicts usually support the metal. Metals Focus, however, expects the rally to return once the situation calms down. The underlying premise: Policymakers are likely to tolerate slightly higher inflation rather than jeopardize economic growth through overly restrictive monetary policy. Conclusion: In 2026, it’s no longer just volume that counts in the gold market The market environment for 2026 is more complex than a purely quantitative analysis of supply and demand would suggest. The buyer structure is changing, strategic players are acting less price-sensitive, and structural drivers such as global debt and geopolitical risks remain. At the same time, supply from mines and recycling is growing only slowly. What is decisive, therefore, is not so much the absolute tonnage of total demand, but rather the fact that gold is undergoing a permanent shift from a consumer good to a strategic investment and reserve asset. The projected average price of $4,920 thus does not reflect mere exaggeration, but rather is an expression of a new, more resilient market structure. Source: https://goldinvest.de/en/gold-price-in-2026-new-market-structure-paves-the-way-for-a-rise-to-usd4-920
Jun 9, 2026 14:13 - Silver: Surfing on gold’s coattails
05 May 2026 Silver has exhibited even greater volatility than gold in Q1 2026. Prices briefly surged to around $120/oz on 29 January, roughly four times higher than a year earlier, before dropping sharply to the mid-$60s within days, easing further to around $61/oz by mid-March. The metal continues to display a strong sensitivity to moves in gold, and we expect that relationship to remain the dominant driver of direction. Industrial demand At January’s price spike, the key concern was that elevated prices could begin to undermine industrial usage. Given that roughly half of total silver demand comes from industrial applications, this remains the most critical component of the market. With prices having moderated, the risk to demand has eased somewhat. Even so, after peaking in 2024, industrial demand softened in 2025 and may edge slightly lower again in 2026. A large part of this dynamic is tied to the solar sector. Installation activity was brought forward ahead of changes to China’s power pricing regime, which is likely to weigh on deployment this year. At the same time, manufacturers continue to reduce the amount of silver used per unit through efficiency gains and material substitution. Industry estimates suggest that these technological improvements have cut silver intensity meaningfully, meaning that even where installations grow, silver demand does not necessarily follow. Despite these headwinds, the long-term backdrop remains supportive. Solar remains one of the cheapest sources of electricity, and structural demand for power continues to rise globally. However, growth is not unconstrained with grid bottlenecks and permitting delays continue to limit the pace of expansion in many regions. Geopolitics may also play a role. The conflict involving Iran could accelerate efforts in Europe and Asia to diversify energy sources and reduce reliance on imported hydrocarbons. While renewable supply chains carry their own risks, these are largely front-loaded in the build phase. Once operational, renewable assets provide domestically generated energy, which enhances energy security. As such, while our base case is for softer solar-related silver demand, there is scope for upside if policy shifts accelerate deployment. Beyond solar, demand linked to data infrastructure, electrification of transport, and investment in power networks should remain supportive. In addition, usage tied to ethylene oxide catalysts is expected to recover following last year’s decline. Figure 1: Industrial silver demand Source: Metals Focus, WisdomTree. 2026. (F) = Forecasts. Forecasts are not an indicator of future performance, and any investments are subject to risks and uncertainties. Investor demand Investor flows were a major feature of 2025. Exchange-traded products (ETPs) saw strong inflows from March through year-end, broadly tracking the rise in prices and reaching one of the highest annual totals on record in volume terms. That trend has reversed in 2026. Outflows have been notable, with investors taking profits even before prices reached their peak in late January. The shift in positioning helps explain the sharp price correction. As participation broadened and leveraged exposure increased into early 2026, the market became more susceptible to rapid deleveraging. When geopolitical tensions escalated, many investors reduced risk and raised cash, leading to a wave of long position closures rather than the build-up of new bearish bets. Physical investment trends have been more mixed. Demand for coins and bars rose strongly in 2025, supported not only by traditional markets such as India, Germany, and Australia, but also by a pickup in East Asia and the Middle East. In these regions, higher gold prices appear to have encouraged substitution into silver. In contrast, US demand weakened significantly, falling to its lowest level in many years. More recently, volatility has dampened appetite across Western markets, with investors taking a more cautious approach during February and March. Figure 2: Silver in Exchange-traded products Source: Bloomberg Finance L.P. September 2020 to April 2026. Historical performance is not an indication of future performance, and any investments may go down in value. Jewellery demand The sharp rise in prices through 2025 and early 2026 has weighed heavily on jewellery demand. Global fabrication fell by 8% in 2025, reflecting broad-based declines. India saw the most pronounced drop, as affordability pressures curtailed demand, while Europe was affected by weaker export activity linked to trade frictions. East Asia proved more resilient, with modest growth in China supported in part by substitution away from gold, and stronger export performance in Thailand. Looking ahead, continued price strength is likely to further suppress demand, while ongoing instability in the Middle East may also weigh on regional consumption. Recycling Higher prices encouraged an increase in recycling last year, with volumes reaching their highest level in over a decade. Gains were most evident in jewellery and silverware, where selling back into the market is more price sensitive. However, the response was not unlimited. Processing constraints within the refining system restricted the amount of material that could be brought back to market, particularly for higher-grade scrap. Industrial recycling moved in the opposite direction, declining due to weaker recovery rates from electronic waste. In 2026, recycling is expected to increase further, supported by a full year of elevated prices. Mine supply Global mine output rose by 3% in 2025, supported by stronger production in countries such as Peru and Russia. At the same time, production costs declined for a second consecutive year, boosting margins for primary silver producers. For 2026, supply is expected to remain broadly stable, with a marginal decline as gains in some regions are offset by weakness elsewhere, particularly in operations linked to lead and zinc mining. It is important to note that the majority of silver supply is produced as a secondary output from other metals, including gold, copper, lead, and zinc. As a result, silver supply is influenced not only by its own price but also by broader dynamics in base and precious metals markets. While higher prices and improved margins may incentivise increased activity, disruptions at both the mine and refining level, along with geopolitical complications, could limit supply growth in the near term. Market balance The silver market is expected to remain in deficit in 2026, with the shortfall broadly similar to that seen in 2025, though significantly smaller than in recent years. Weaker demand from industrial and jewellery segments has helped narrow the imbalance. At the same time, strong inflows into ETPs last year effectively absorbed available supply, tightening underlying conditions more than headline balances suggest. With investor demand likely to moderate this year, some of that pressure should ease, bringing the market closer to equilibrium. Figure 3: Silver market balance Source: Metals Focus, WisdomTree. 2025. (F) = Forecasts. Forecasts are not an indicator of future performance, and any investments are subject to risks and uncertainties. Price outlook We retain a positive outlook for gold and expect silver to move in the same direction. Even with softer demand across several segments, the strength of this relationship should provide support. Based on our modelling assumptions, and assuming gold rises by around 18% between Q1 2026 and Q1 2027, we estimate that silver could increase by roughly 24% over the same period. Much of this upside is driven by gold’s trajectory rather than silver-specific fundamentals. There are, however, constraints. Increased investment in mining capacity last year may translate into higher supply, limiting upside potential. In addition, while economic indicators such as PMIs 1 remain in expansionary territory, geopolitical uncertainty continues to weigh on the strength of the recovery. Figure 4: Forecast attribution Source: WisdomTree, Bloomberg. Forecasts are not an indicator of future performance, and any investments are subject to risks and uncertainties. Conclusion Silver’s outlook is shaped less by its own fundamentals and more by its relationship with gold. Although weaker industrial and jewellery demand, along with more moderate investment flows, may create near-term headwinds, these factors are unlikely to outweigh the support provided by a favourable macro backdrop for precious metals. With the market still in deficit and structural demand drivers intact, silver remains well positioned to participate in further upside, albeit with continued volatility. Source: https://www.wisdomtree.eu/en-gb/blog/2026-05-05/silver-surfing-on-golds-coattails
May 11, 2026 09:59 - Silver Back Above Critical Level: Why the Metal Is Currently Outperforming Gold
8. May 2026 The silver market is showing its dynamic side again this Thursday. Spot silver (XAG/USD) jumps around 2 percent higher during the day and is trading clearly above the psychologically important $80 mark . The white metal is thus continuing its recovery following the sharp pullback of recent weeks—and is currently even outperforming its big brother gold. From All-Time High to Correction—and Back Again To put the recent strength into perspective, it’s worth looking back: In January 2026, silver marked a new all-time high at $121.64 per troy ounce, definitively breaking through the long-standing $50 resistance zone. But after this spectacular breakout came disillusionment: with the onset of the Strait of Hormuz conflict in late February, the precious metal came under massive pressure. By early May, silver had plunged around 22 percent from its highs, driven by concerns that central banks might maintain their restrictive course longer in light of rising energy prices. The current movement is noteworthy in this respect: according to Kitco , the silver price rose to $79.92 per ounce on May 8, 2026—a gain of 2.09 percent from the previous day. Silver futures climbed in parallel to $80.625. This is more than a technical reflex: silver is thus trading significantly above the early May level, when the troy ounce was still trading below $73. The Dual Leverage: Safe-Haven and Industrial Metal What distinguishes silver from gold is the metal’s hybrid character. Around half of global silver demand comes from industrial applications—from solar modules to electronics to medical technology. This dual nature explains why silver swings more violently in both directions than gold: in phases of high risk aversion, the safe-haven effect takes hold; in phases of economic expansion, industrial demand picks up. The structural drivers in particular remain intact. Growth impulses continue to come from photovoltaics, electromobility, semiconductors, and AI infrastructure. Several analysts expect industrial demand to exceed supply in 2026 as well. Added to this is a scarcity component the market is underestimating: the lead time for new silver mines is often seven to ten years, and since January 2026, Chinese export restrictions have additionally burdened global supply. Investment demand also remains robust. According to the latest World Silver Survey data, global physical investment demand in 2025/early 2026 was at a multi-year high—driven primarily by Indian investors and a notable shift in European precious metals trading toward silver. The Gold-Silver Ratio Sends Mixed Signals The development of the gold-silver ratio is intriguing, traditionally one of the most important valuation indicators in the precious metals market. Currently, the ratio stands at around 61, after temporarily falling to a low of 43. The historical average ranges between 65 and 75. In other words: silver is neither dramatically undervalued nor clearly overvalued relative to gold. The pronounced relative undervaluation that was the central driver for silver bulls in recent years has largely been worked off. This observation calls for caution. LBBW strategists, for example, argue that sustained outperformance of silver versus gold is rather unlikely given the weak global economy and high industrial dependence. Those investing in silver are therefore no longer just buying the hope of ratio normalization, but are increasingly betting on a classic cyclical upswing. Technical Analysis: The Next Critical Levels From a technical perspective, silver stands at a technically delicate point. The first resistance runs at $81.81, followed by $82.50; a breakthrough would unlock the next price target at $84. On the downside, the central support lies at $73.14, followed by $72 and $70.90. As long as silver holds above the $73 region, the overall picture remains constructive. Rally Launch or Overextended Reflex? The honest answer is: both are possible—and that’s precisely what makes silver so attractive yet risky in the current environment. Arguments for a new upward thrust include structural supply scarcity, sustained investment demand, and the prospect that the Fed could return to loose monetary policy in the medium term. Once gold resumes its uptrend, silver historically tends to follow at significantly higher speed—the classic high-beta pattern. Arguments against include the fragile geopolitical situation in the Persian Gulf, the still restrictive monetary policy, and the risk that an economic slowdown could dampen industrial demand. The recent price behavior—a loss of around 22 percent in just a few weeks—also demonstrates how painful this metal’s volatility can be. Conclusion for investors: Silver remains the most exciting precious metal in 2026—but also the most demanding. The recent rebound above $80 is an initial bullish signal that makes a technical bottom formation more likely. However, a sustainable trend reversal requires breaking the $82 mark. Those entering should be aware that short-term fluctuations of 5 to 10 percent in either direction are normal. For strategically oriented precious metals investors, this changes nothing about the fundamental attractiveness—on the contrary: corrections like those of recent weeks have historically often been the better entry windows. Source: https://goldinvest.de/en/silver-back-above-critical-level-why-the-metal-is-currently-outperforming-gold/
May 11, 2026 09:50 - Global Silver Investment Hits Record High, Driven by Indian and European Demand Surge
[SMM Precious Metals Market News] According to the latest data from the World Silver Survey, global physical investment demand reached its highest level in years during the first few months of 2025 and 2026, primarily driven by the participation of Indian investors and a significant shift in European precious metals trading toward the silver sector.
May 11, 2026 09:01 - Silver Market Before a Price Surge? China’s Record Imports Meet Tight Inventories
The silver market is currently benefiting from a massive, multi-dimensional tailwind—a combination that makes the setup extremely exciting for investors. A prime example of this dynamic is China, where silver imports in March exploded to the highest monthly value ever recorded.
Apr 27, 2026 17:23 - Silver ahead of the next surge? Deficit, battery boom & government purchases are heating up the market
The global silver market is in a phase that is historically rare in this form: persistent supply deficits, potentially transformative demand from battery technology, government accumulation programs, and a growing decoupling of Asian prices from Western benchmarks. Reason enough to take a closer look at the key developments in detail.
Apr 24, 2026 09:24 - Silver Faces Sixth Consecutive Deficit Year: New Shortage Threatens in 2026 – With Explosive Price Potential!
The silver market is likely to remain in a tight situation in 2026 as well – and this could demand quite a bit from investors and industry in the coming months.
Apr 17, 2026 09:43 - Silver Price Plunged Then Soared 13.8% in a Deep V-Shaped Reversal During Chinese New Year, Post-Holiday Industrial Consumption Cautious vs. Investment Demand Hot [SMM Analysis]
During the Chinese New Year holiday, overseas precious metals were affected by multiple factors such as US macro policies and Middle East geopolitical conflicts, with silver prices showing a V-shaped reversal trend, falling first and then rising. As of the close on February 23, London spot silver settled at $88.17 per ounce, up approximately 13.8% from the pre-holiday closing price of $77.46 per ounce on February 13. Due to the drag from pre-holiday US stock declines and weakening liquidity, overseas precious metals continued their decline at the beginning of last week, with silver and platinum once falling below the 60-day moving average and gold losing the 20-day moving average. Subsequently, as the US announced that the Q4 GDP growth rate fell short of expectations, precious metals stopped falling and rebounded. After the US Supreme Court ruled to revoke most tariffs imposed by the Trump administration last year and Trump immediately announced an additional 10% tariff on globally imported goods to the US within the next 150 days, market concerns over trade conflicts and economic downturn were reignited. Coupled with the deadlock in US-Iran negotiations potentially worsening the Middle East situation, which stimulated safe-haven demand, precious metals surged significantly during the session and recovered previous losses, with silver leading the gains. During the 2026 Chinese New Year holiday, refined silver supply from copper, lead, and zinc smelters mainly maintained stable production, while large-scale downstream enterprises such as silver nitrate and alloy manufacturers generally suspended operations for the holiday. Except for a few small and medium-sized silver-based material, jewelry, and some industrial users processing urgent orders normally, downstream consumption temporarily stalled due to holiday factors and the high silver price and premium market conditions. Although multiple smelters mentioned accumulated in-factory inventory after the holiday, compared to previous years, the destocking speed for the accumulated inventory after the 2026 holiday was faster. Some manufacturers transferred in-factory inventory to social warehouses on the first day after the holiday and prepared for delivery or sold directly at market premiums. Smelter in-factory inventory levels are expected to gradually decrease to safe levels. Looking ahead this week, although import tariffs on investment-grade gold and silver are exempted, the policy's impact on US dollar assets and its boost to precious metal allocation demand will both benefit gold and silver prices. The market will further price in the impact of Trump's tariffs. In the spot market, physical investment demand for precious metals may again see stockpiling and rush to buy amid continuous price rises. Some downstream enterprises expect to purchase physical goods from the exchange after the delivery of the SHFE February contract ends, thus cautiously watching the high premium quotes for circulating supplies after the holiday. Additionally, it is worth noting that the significant volatility in silver prices in early 2026 and the hedging liquidity pressure brought by the exchange's raised margins have prompted intermediate silver-containing material processing manufacturers to weigh between maintaining customer relationships with orders at breakeven or even small losses and halting production to stop losses. Although downstream enterprises resumed normal operations after the holiday, most industrial enterprises basically did not take new orders during the holiday. Post-holiday orders for silver nitrate and electronic/electrical intermediate processing products are expected to be average. Spot transactions are mainly driven by investment demand, with jewelry and investment silver bar processing recovering quickly. Industrial consumption end-users currently have low acceptance of the significantly increased prices and post-holiday spot premiums, thus placing orders relatively cautiously. After the holiday, the precious metals market is partially hot but overall sluggish. Besides macro disturbances and geopolitical changes, subsequent attention should still be paid to premium changes after the delivery of the SHFE front-month contract and whether low inventory in overseas COMEX will again cause price anomalies.
Feb 24, 2026 16:10 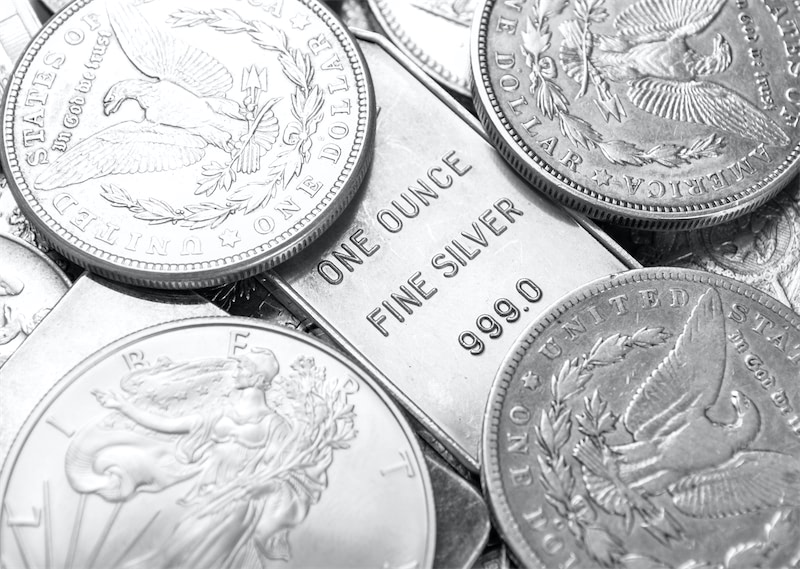 Global Silver Investment to Remain Strong in 2026 Against the Backdrop of a Sixth Consecutive Annual Market Deficit
(Washington, D.C. – February 10, 2026) After posting its strongest annual performance since 1979 last year, silver prices continued to set new highs in 2026, fueled by rising investor interest.
Feb 11, 2026 09:27