

1993results found for 'tariff'
Price
News
- Expectations of Hormuz Reopening Ease Inflation Concerns, Domestic and Overseas Inventory Mismatch Pushes Up Copper Prices [SMM Macro Weekly Review]
On the macro front , this week copper prices drifted higher overall. Negotiations between the U.S., Iran, and Oman over the Strait of Hormuz made progress, and market expectations for a near-term reopening of the strait heightened. International oil prices pulled back accordingly, easing inflation worries from energy prices. Meanwhile, the U.S. July ADP employment figure came in below market expectations, and the cooling labour market also dampened market expectations for multiple US Fed rate hikes this year. Although some Fed officials still sent hawkish signals and the strait reopening arrangements are not yet fully clear, their pressure on copper prices was relatively limited. Additionally, expectations that the U.S. may impose tariffs on imported copper continued to attract copper cathode flows to the U.S., driving inventory accumulation at COMEX. Meanwhile, LME inventories and deliverable stocks kept declining, creating a clear regional mismatch of exchange inventories. U.S. tariff premiums and tightening supply outside the U.S. combined to push LME copper prices higher. As of 11:00 Beijing time on August 7, 2026, LME copper hit a low of $13,769/mt this week before shooting up to a high of $14,369/mt, up $600/mt from the low, a gain of about 4.36%. The most-traded SHFE copper contract hit a low of 105,140 yuan/mt, then rebounded to 108,470 yuan/mt, up 3,330 yuan/mt from the low, a gain of about 3.17%. Fundamentals side , as of August 6, SMM copper inventories across major regions in China increased by 7,300 mt WoW to 119,200 mt, extending the accumulation trend. On the supply side, arrivals of both domestic copper and imported copper cathode increased recently, with imported materials such as Peruvian large plates, ESOX, and Myanmar copper gradually circulating in the market. Combined with higher copper prices boosting suppliers’ willingness to sell, spot supply that was previously tight gradually eased. On the demand side, end-user orders were generally weak amid the traditional consumption off-season, and high copper prices further suppressed downstream purchase willingness. Market transactions were sluggish, and purchases remained mainly need-based. However, hi-quality copper and registered SX-EW copper supplies were relatively limited, and transactions improved for some low-priced cargoes, still providing some support to spot premiums. Looking ahead to next week , the market will continue to watch whether the U.S.-Iran deal materializes, the Strait of Hormuz reopening arrangements, and Fed officials’ comments on the future rate path. If expectations for the strait's reopening persist, oil prices and inflation worries will cool further, and together with a slowing U.S. labour market, macro sentiment may still support copper prices. Should negotiations falter again, geopolitical risks and energy price fluctuations could increase volatility in the futures market. In addition, watch out for a resurgence of resource protectionist policies outside China, which could further disrupt global copper flows. Fundamentals side, increasing domestic and imported copper supply will continue to ease domestic spot supply tightness, but high copper prices, inventory accumulation, and the off-season will limit downstream restocking, and SHFE copper spot premiums still face downward pressure. Next week, copper prices are expected to consolidate at highs with an upward bias, with LME copper likely to outperform SHFE copper, but SHFE copper’s upside room will still be constrained by weak domestic demand.
Aug 7, 2026 13:24 - US Finalizes Section 232 Measures on Polysilicon: Price Floors Could Reshape the U.S Solar Supply Chain [SMM Analysis]
A four-tier minimum import price regime, downstream tariffs and onshoring incentives will take effect on December 4, 2026, widening the gap between US and Asian solar prices. On August 6, US President Donald Trump signed a proclamation setting out import adjustment measures following the Section 232 investigation into polysilicon and its derivatives. The measures will take effect at 12:01 a.m. Eastern Time on December 4, 2026, and cover polysilicon, silicon ingots and wafers, solar cells and modules. Unlike a conventional tariff increase, the new framework combines minimum import prices, or MIPs, with additional tariffs on downstream products and incentives for domestic investment. SMM believes the policy should not be read as a blanket 15% tariff on every product in the polysilicon value chain. Its central objective is to rebuild the US solar pricing system through a combination of price floors, cumulative tariffs and conditional relief. Low-priced imports will face a substantially greater constraint than products already trading at higher prices. The impact is also expected to move progressively through the supply chain, from polysilicon and wafers to cells and finished modules. Four price floors introduced; the 15% tariff mainly applies downstream According to the White House proclamation and its annexes, the United States has established minimum import prices of $21/kg for polysilicon, $100/kg for silicon ingots and wafers, $0.22/W for solar cells and $0.38/W for solar modules. An important distinction applies to raw polysilicon. The material is covered by the MIP program, but the 15% additional ad valorem duty set out in paragraph 4 of the proclamation applies to silicon ingots, wafers and downstream derivatives. It would therefore be inaccurate to state that every product across the polysilicon value chain is subject to a uniform additional 15% tariff. Rates also vary by origin. For products from European Union member states, Japan, South Korea, Chinese Taipei, Switzerland and Liechtenstein, the combined Column 1 general duty and Section 232 duty is set at 15%. Products from the United Kingdom are subject to a 10% Section 232 additional duty. Other origins are generally subject to a 15% additional duty, which may be applied alongside anti-dumping duties, countervailing duties and other applicable charges unless otherwise specified. The measures establish a new import-protection framework following the expiry of the Section 201 safeguard in February 2026. Compared with the previous safeguard, the Section 232 regime has a much broader reach. It places silicon ingots and wafers within the additional tariff framework and introduces price floors at four stages from raw material to finished module. Customs enforcement turns the MIP into a binding threshold The MIP is not simply a reference quotation. When entering goods, importers may submit documentation showing that the first arm's-length transaction price in the United States is no lower than the prescribed threshold. They may also document that the transaction is being executed under a fixed-term contract with fixed terms signed before August 6, 2026. If documentation is submitted but the entered value remains below the MIP, US Customs and Border Protection may impose a specific duty equal to the gap between the declared price and the price floor. If the required documentation is not submitted, the importer may face a specific duty equal to the full MIP. For silicon ingots, wafers, cells and modules, the relevant ad valorem tariff may then be added on top of that amount. The effective barrier could therefore be considerably higher than the headline 15%. For a module from a generally applicable origin, a first arm's-length US transaction price of $0.38/W would still need to absorb the 15% additional tariff and any other applicable duties. If the transaction price is below $0.38/W, the importer could also face a specific duty that fills the gap to the MIP. For suppliers that previously competed primarily on price, the MIP may have a greater commercial effect than the ad valorem tariff itself. The proclamation also provides for strict enforcement. Materially false supporting documents could result in the importer and its affiliates being permanently barred from importing covered products. The Department of Commerce will monitor abnormal stockpiling before December 4 and may coordinate with Customs to restrict subsequent imports where companies are found to have accelerated shipments or built excessive inventories. The nearly four-month transition period should therefore not be interpreted as an unrestricted stockbuilding window. US price floors sit far above current Asian supply-chain prices As of August 6, SMM assessed average prices for n-type recycled feedstock and n-type dense polysilicon in China at RMB 32.95/kg and RMB 32.15/kg, respectively. Both had fallen by approximately 12.7% and 13.1% from April 1. Using an exchange rate of RMB 6.7483 per US dollar, the two prices were equivalent to approximately $4.88/kg and $4.76/kg. They were 76.7% and 77.3% below the US polysilicon MIP of $21/kg. Put differently, the US price floor is approximately 4.3-4.4 times the current Chinese spot price for n-type polysilicon. The gap is even wider downstream. SMM assessed G12R TOPCon modules at a China port FOB average of $0.1055/W. The US module MIP of $0.38/W is about 3.6 times that level. SMM's China port FOB assessment for G12R TOPCon cells stood at $0.0395/W, making the US cell MIP of $0.22/W approximately 5.6 times the Chinese export price. These comparisons do not represent identical trade terms. China port FOB prices exclude ocean freight, insurance, customs clearance, distribution and financing costs incurred after the product leaves China, and they are not equivalent to the first arm's-length transaction price in the United States. Even so, the scale of the gap shows that the policy is not a marginal adjustment to import pricing. It is an attempt to establish a protected US price curve that is materially detached from Asian spot levels. According to SMM research, average quotations for US-made white-backsheet modules were recently around $0.31/W. Southeast Asian modules delivered duty paid to the United States were quoted at approximately $0.27/W, while Indian non-DCR modules were around $0.14/W. On a nominal-price basis, the $0.38/W module MIP is approximately 22.6% above the US-made module quotation. Once applicable Section 232 duties are added, the cost gap between imported and domestically produced modules could widen further, strengthening the relative competitiveness and pricing power of US manufacturers. US solar assets continue to expand despite lower module imports The ultimate cost impact of the new tariffs and price floors will depend on the pace and structure of US solar deployment. EIA data show that cumulative operating solar net summer capacity increased from 138.3 GW at the end of 2023 to 175.3 GW at the end of 2024 and 209.3 GW at the end of 2025. By the end of May 2026, it had reached 222.7 GW, a net increase of approximately 13.4 GW from year-end 2025. Solar generation also continued to grow. In 2025, US utility-scale solar generation reached approximately 296 TWh, up 34% year on year, while small-scale solar generation rose 11% to around 93 TWh. Combined output was approximately 389 TWh. The data indicate that the operating asset base and actual solar generation continued to expand even as finished-module imports declined. The cost effect of Section 232 therefore cannot be assessed from short-term import movements alone. If US solar capacity continues to grow while domestic wafer and cell projects ramp more slowly than module assembly, the import price thresholds will be more readily passed through to module and project costs. If construction slows because of financing, permitting or interconnection constraints, the policy may instead be reflected mainly in greater pricing power for domestic manufacturers rather than an immediate physical shortage. Module imports fell 39%, while cell imports rose 57% USITC data reveal a clear structural shift in the US solar supply chain. In 2024, the United States imported 54.3 GW of crystalline-silicon modules and 13.89 GW of crystalline-silicon cells. In 2025, module imports fell 39.2% year on year to approximately 33.0 GW. Cell imports, aggregated from country-level data, rose 57.1% to about 21.82 GW. The divergence between declining module imports and rising cell imports shows how the expansion of US module assembly is changing the import mix. A growing portion of demand is being met through imported cells assembled into modules in the United States rather than through direct imports of finished modules. This shift does not mean that the US solar manufacturing chain has achieved full localization. On the contrary, it highlights cells as the most important import-dependent link at this stage. Import volumes and newly installed capacity cannot be matched on a watt-for-watt basis because of inventory changes, manufacturing lead times and differences in statistical scope. Nonetheless, the opposite direction of cell and module imports in 2025 clearly indicates that the United States is moving from a finished-module import model toward one in which imported cells support domestic module manufacturing. The next stage of localization may extend further upstream into wafers and polysilicon. The US Department of Energy has also noted that cells, wafers and polysilicon require more capital and generally have longer design, permitting, construction and ramp-up cycles than module assembly. The rise in cell imports to 21.82 GW in 2025 provides trade-data evidence that rapid module-capacity growth has not yet reduced US reliance on foreign cells. Against this backdrop, the $0.22/W cell MIP and the additional 15% tariff will have two effects. They may protect domestic cell projects and create more room for upstream investment, but they could also raise production costs for US module plants that still depend on imported cells before domestic cell capacity is fully available. Whether companies can obtain relief under the onshoring program, and whether US cell projects begin production and ramp on schedule, will determine whether the measure functions primarily as protection for domestic manufacturing or becomes an upstream cost squeeze on downstream module producers. Import origins have shifted, but Section 232 narrows the scope for rerouting Indonesia supplied 13.34 GW, or 40.4%, of US crystalline-silicon module imports in 2025. Laos supplied 5.48 GW, or 16.6%. Together, the two countries accounted for 57.0% of the total. Imports from Vietnam, India, Thailand and Malaysia reached approximately 3.39 GW, 3.08 GW, 2.88 GW and 2.17 GW, respectively. Cell imports were even more concentrated. In 2025, the United States imported approximately 6.47 GW of cells from Indonesia, 4.53 GW from Laos, 3.65 GW from Malaysia, 3.30 GW from South Korea and 3.02 GW from Thailand. The five largest origins accounted for 96.1% of the total, while Indonesia and Laos together represented around 50.5%. Country-level data show that US module sourcing has moved beyond the four Southeast Asian countries traditionally targeted by trade cases and has diversified toward Indonesia, Laos, India, Ethiopia and the Philippines. Unlike anti-dumping and countervailing duty investigations focused on named countries, the Section 232 MIPs cover products from a broad range of origins. This will substantially reduce the ability of suppliers to preserve low-cost access to the US market simply by changing the location of module assembly or cell exports. US solar manufacturing stocks rose, but the benefit differs by company US-listed solar manufacturing stocks responded quickly after the policy announcement. Public market data show that First Solar rose as much as approximately 8% in after-hours trading, while T1 Energy gained as much as 6.3%. The reaction reflects investor expectations that the domestic manufacturing premium will widen. First Solar uses cadmium telluride thin-film technology and does not rely on the crystalline-silicon polysilicon chain. Its main benefit would come from improved relative competitiveness if imported crystalline-silicon modules become more expensive. However, the cell and module tariff lines listed in the annex cover both crystalline-silicon products and other photovoltaic products. Whether imported thin-film modules fall within the final measures will depend on customs classification and implementation guidance. First Solar's share-price response is therefore better understood as a revaluation of its US manufacturing advantage rather than a direct benefit from lower polysilicon costs. T1 Energy operates module manufacturing capacity in the United States and is developing domestic cell capacity. Its US manufacturing position stands to benefit from a higher import threshold for finished modules. Before its domestic cell lines are fully ramped, however, the cell MIP could also raise input costs. The company's net benefit will depend on the pace of its US cell buildout and whether it can secure Section 232 relief for qualifying equipment and covered products under an approved onshoring plan. For domestic polysilicon producers such as Hemlock Semiconductor and Wacker's US operations, the $21/kg MIP offers more direct price protection. For integrated manufacturers such as Qcells, which is building wafer, cell and module capacity in the United States, the framework could narrow the cost gap between domestic production and Asian imports. US manufacturers gain protection, but project costs face upward pressure In the short term, some existing contracts and in-transit orders may retain transitional treatment before December 4, and US importers may accelerate the delivery of compliant orders. The anti-stockpiling provisions will limit excessive front-loading, however, creating a distinction between the earlier delivery of normal orders and restricted abnormal inventory accumulation. Over the medium term, the $0.38/W module MIP, together with additional tariffs, will significantly narrow the low-cost advantage of imported crystalline-silicon modules. US module manufacturers should gain greater pricing flexibility and improved order visibility, while developers face higher capital expenditure and levelized electricity costs. Projects already under pressure from the phase-down of federal incentives, interconnection queues or financing costs may need to recalculate returns or delay procurement. The scale of the impact will also depend on the structure of US demand. If solar deployment maintains its current growth trend and domestic capacity can cover the required power classes and delivery specifications, lower imports may be partly replaced by domestic supply and inventories. If demand from data centers and utility-scale projects shifts more rapidly toward higher-power and higher-efficiency products while US wafer and cell capacity ramps more slowly than expected, the supply gap could amplify price increases and project-delay risks. Direct exports from China may face limited incremental impact, but third-country supply chains face greater pressure Chinese solar products already face US anti-dumping and countervailing duties, forced-labor enforcement, country-of-origin scrutiny and other trade restrictions. The incremental effect of the new Section 232 measures on direct exports from China may therefore be smaller than the size of the MIPs alone suggests. The new measures are broad in both tariff classification and origin, however. Producing wafers, cells or modules in Southeast Asia, India or other third countries will no longer provide the same scope to secure US market access through low prices alone. Companies that rely on imported cells for US module assembly, or that plan to expand in third countries to serve the US market, will face higher costs and compliance pressure. As the US price threshold rises, some modules originally intended for the United States may be redirected to Europe, Latin America, the Middle East and other Asia-Pacific markets, intensifying competition for orders in those regions. Chinese companies will need to go beyond changing export destinations. They should reassess US investment, supply-chain traceability, tariff classification, related-party pricing and contract structures with local customers. Onshoring relief creates an investment route, but the threshold is high The proclamation authorizes the Department of Commerce to establish an onshoring incentive program. Companies that commit to building, refurbishing or expanding US capacity for polysilicon, silicon ingots, wafers or cells, and begin construction by January 20, 2029, may submit a company-level onshoring plan. During construction, approved companies may import necessary production equipment and covered products at a volume linked by Commerce to the scale of the new investment without paying the applicable Section 232 duties. The framework does not close the US market entirely. Instead, it seeks to tie import relief to domestic capital expenditure. The policy may accelerate investment decisions in US wafer and cell production, but effective supply will still depend on construction schedules, equipment delivery, skilled labor, energy costs and downstream orders. If a company fails to meet its commitments, the relief may be withdrawn. Fraud or misrepresentation could also result in retroactive revocation. Outlook: trade protection will interact with the expiry of project tax credits SMM believes the Section 232 measures upgrade US solar trade protection from country-specific anti-dumping and countervailing duty actions into a price-management system spanning the value chain and multiple origins. The central constraint is not the nominal 15% rate alone, but the combined barrier created by MIPs, additional duties, existing trade remedies and strict certification and enforcement. In the short term, the US market may see faster delivery under existing contracts, higher domestic module quotations and contract renegotiations by developers. The medium-term impact will depend on three variables: how the Department of Commerce defines eligibility and relief volumes under the onshoring program; whether US wafer and cell capacity comes online on schedule; and whether trading partners such as the EU, Japan and South Korea adopt MIP systems that the United States regards as substantially equivalent, potentially triggering tariff adjustments. The Section 232 measures must also be considered alongside the termination schedule for US clean electricity tax credits. Under the current rules, solar projects that begin construction after July 4, 2026 and enter service after December 31, 2027 will generally no longer qualify for the Section 45Y clean electricity production tax credit or the Section 48E clean electricity investment tax credit. Projects that satisfied the applicable construction-start requirements before July 5, 2026 may still seek transitional eligibility under the physical-work and continuity rules. The entire US solar market will not lose tax credits at the end of 2027; the deadline primarily constrains new projects that did not begin construction within the transition window. This schedule could bring demand forward. From the second half of 2026 through 2027, some developers may accelerate equipment orders, construction and grid connection to complete projects before the tax-credit deadline. If the Section 232 MIPs take effect at the same time, concentrated procurement and higher import costs could reinforce each other, lifting domestic module quotations and equipment budgets. From 2028, project performance is likely to diverge more sharply. Projects with transitional eligibility, long-term power purchase agreements or demand support from high-load customers such as data centers may continue. Projects that cannot claim the 45Y or 48E credits and are highly sensitive to equipment costs may renegotiate contracts, reduce scale or delay development. If the imported-module MIP remains at $0.38/W while domestic production costs have not fallen materially, the loss of project-side tax credits and elevated equipment prices will create a double squeeze on project economics. Section 45X should be distinguished from Section 48E. The Section 45X advanced manufacturing production credit does not end in 2028. Under current IRS rules, qualifying modules, cells, wafers and polysilicon remain eligible for the full manufacturing credit through the end of 2029. The credit then falls to 75% in 2030, 50% in 2031 and 25% in 2032 before ending after December 31, 2032 for the relevant components. The result could be a policy mismatch in 2028-2029: some demand-side projects will lose federal tax credits while manufacturers retain the full production incentive. The Section 232 MIPs may therefore serve not only as trade protection, but also as a mechanism supporting domestic manufacturing margins before and during the Section 45X phase-down. If domestic capacity comes online rapidly with 45X support while project deployment slows following the termination of 45Y and 48E eligibility, US manufacturing capacity could grow faster than project demand. Conversely, if data-center load growth, power shortages and state procurement programs continue to support installations, the Section 232 price threshold may help domestic producers maintain higher selling prices as 45X support declines. The central tension in the US solar market will consequently shift from competition between imports and domestic manufacturing toward whether the pace of manufacturing expansion can match installation demand without federal project-level tax credits. For the global solar market, the United States is likely to develop an increasingly distinct domestic price system that is further decoupled from the low-cost Asian supply chain. US manufacturers will receive greater protection, but project development costs and supply-chain complexity will also increase. Competition will increasingly center on domestic capacity, technology, supply-chain traceability and policy eligibility rather than module price alone. SMM will continue to track implementation guidance from the US Department of Commerce and Customs and Border Protection, adjustments to the minimum import prices, approvals under the onshoring program, and the subsequent impact on polysilicon, wafer, cell and module prices and company shipments. Written by: Ryan Tey Tze Yang | SMM PV Analyst +60 127179370 | ryan.tey@metal.com
Aug 7, 2026 11:17 - [Solar: US to impose Section 232 minimum import prices and 15% tariffs on polysilicon derivatives]
The US president has issued a proclamation based on the Commerce Department’s Section 232 investigation, introducing import measures on polysilicon and its derivative products to protect semiconductor and solar supply-chain security. From Dec. 4, 2026, the US will apply a minimum import price mechanism of USD 21/kg for polysilicon, USD 100/kg for ingots and wafers, USD 0.22/W for solar cells, and USD 0.38/W for solar modules. The proclamation also imposes an additional 15% ad valorem duty on relevant polysilicon derivatives, with a 10% rate for UK products and a combined 15% tariff treatment for products from Japan, Korea, Taiwan Province of China, Switzerland, Liechtenstein and the EU. It also authorizes the Commerce Department to establish an onshoring incentive program for US polysilicon, ingot, wafer and cell production. SMM believes the measures, if implemented, would significantly raise the import price floor for solar products entering the US, strengthen the push for domestic manufacturing, and increase compliance and cost pressure on overseas module, cell and upstream material suppliers.
Aug 7, 2026 08:35 - Copper Shipments Surge into US Amid COMEX-LME Price Premium and Tariff Uncertainty
Copper shipments into the United States continued to surge as traders sought to capitalize on the price premium between the COMEX and London Metal Exchange (LME) markets ahead of a potential U.S. decision on refined copper import tariffs. According to IHS Markit shipping data, more than 200,000 tonnes of refined copper arrived at U.S. ports during July, marking the highest monthly inflow in more than a decade. Combined inventories held on COMEX and LME facilities in the United States have now exceeded 740,000 tonnes, while additional material remains in storage at U.S. ports awaiting delivery. The movement of metal into the U.S. has tightened availability in other key trading hubs. Market participants reported significant inventory declines at bonded warehouses in Shanghai, where stocks have fallen sharply since the beginning of the year as cargoes have been redirected to the U.S. to capture favorable arbitrage opportunities. The premium of COMEX copper over LME prices has remained well above historical norms, providing sufficient margin to offset transportation, insurance and warehousing costs. The shift comes as the U.S. administration continues to evaluate potential tariffs on refined copper imports. While the timing and scope of any measures remain uncertain, the prospect of future trade restrictions has already reshaped global trade flows and inventory distribution. The continued migration of copper inventories into the United States is tightening physical availability across international markets and supporting a firmer supply outlook outside North America. Any delay, revision or cancellation of proposed U.S. import tariffs could narrow the COMEX-LME price premium, potentially reversing some of the recent inventory movements and increasing short-term price volatility.
Aug 6, 2026 15:39 - Platinum and palladium posted significant gains during the week, while spot market consumption remained sluggish [SMM Platinum and Palladium Weekly Review]
[Platinum and Palladium Price Review and Forecast] This week (from July 31 to August 6), platinum and palladium prices moved sideways before breaking out and rebounding strongly, ending the week with a sharp overall gain. At the start of the week, signals from US-Iran negotiations showed renewed divergence, with Trump and the Iranian military each holding their own stance on navigation in the Strait of Hormuz. The Middle East situation remained in a stalemate. This, combined with the continuation of a hawkish tone from the US Fed's July FOMC meeting, where rates were held steady but internal division intensified (9:3 vote, with three voters advocating a rate hike), kept the US dollar and Treasury yields high. As a result, platinum and palladium futures mainly consolidated. Mid-week, US Treasury Secretary Bessent signaled that a deal between the US and Iran, including the reopening of the Strait of Hormuz, was likely on August 4 or 5. International oil prices plummeted overnight, easing inflation expectations and driving down expectations for US Fed rate hikes (the probability of a September rate hike fell from around 72% to near 58%). Additionally, the US Commerce Department's plan to add 14 downstream derivatives of steel, aluminum, and copper to the Section 232 tariff scope raised the tail-end premium for platinum group metals (PGMs) trade protection. Combined with the release of oversold short positions and the return of safe-haven funds after platinum and palladium had cumulatively plunged over 45% year-to-date, the most-traded NYMEX platinum and palladium contracts both surged about 7.4% in the night session on August 4, marking their largest single-day gain since February 2026. This directly drove the domestic market to open higher with a gap and rally strongly on August 5, with the GFEX most-traded platinum contract settling at 441.15 yuan/g and the palladium contract at 329.65 yuan/g, both hitting new highs since early July. At the end of the week (August 6), the US ADP employment data for July showed only 44,000 new jobs, below expectations and the lowest this year. The weakness in small nonfarm data further dampened rate hike expectations. This, along with Iranian Deputy Foreign Minister's statement that the Hormuz navigation agreement with Oman was near finalization (with the new temporary route expected to be available for 2-4 months) and continued easing US-Iran tensions, kept platinum and palladium slightly higher, consolidating at highs. However, on the same day, US Fed Governor Cook reiterated readiness to raise rates if inflation didn't slow, signaling that hawkish cues remained. Platinum and palladium continued to consolidate at highs for the short term. The GFEX most-traded platinum contract hit a weekly high of 444.5 yuan/g and a low of 398.7 yuan/g, closing at 433.5 yuan/g as of August 6, for a weekly gain of about 8.4% for platinum. The most-traded palladium contract hit a weekly high of 333.75 yuan/g and a low of about 300.4 yuan/g, closing at 325.75 yuan/g as of August 6, for a weekly gain of about 6.5% for palladium. In the spot market, driven by the sharp single-day futures rally on August 5, spot discounts for platinum and palladium widened slightly compared to the previous week. Spot prices lagged behind in the rally due to the spot-futures linkage. Mainstream quotations for platinum were quoted at discounts of about 4-2 yuan/g against the most-traded contract, and palladium discounts were about 3.5-1.5 yuan/g. As futures prices kept rising, downstream buying interest remained low, with bid-ask spreads widening. Trader warehouse warrant quotes were relatively firm, concentrated around discounts of 2 yuan/g against the GFEX most-traded contract. Consumption in automotive catalysts and industrial sectors stayed weak, with end-users mainly restocking on a need basis. Overall, spot market consumption for platinum and palladium continued to be sluggish throughout the week. Looking ahead, platinum and palladium prices are currently in a rebound phase following oversold corrections, with both short-term upward drivers and downward constraints coexisting. On the bullish side, after deep corrections, short positions have been partially released, and the logic of fund inflows and oversold recovery remains in place. If the US-Iran navigation agreement is substantively finalized, oil prices and inflation expectations retreat further, and expectations for US Fed rate hikes converge, the valuation recovery for precious metals will continue. Trade protection expectations from Section 232 tariffs form a mid-term support floor. However, excessive optimism about the upside room and sustainability is not warranted. The core constraints are: first, this rebound is mainly driven by "international price correlations + oversold recovery fund flows," and the supply-demand fundamentals haven't undergone a reversal, with institutions widely questioning sustainability; second, the US Fed's hawkish stance remains unshaken, and the 9:3 divide in the July FOMC shows rate hike expectations for this year have not reversed, with the probability of a September rate hike still high, capping rates; third, doubts about the US-Iran agreement's implementation and escalating Houthi blockades in the Red Sea mean oil prices and inflation expectations could fluctuate again, potentially restarting a negative feedback loop. Future price direction still awaits further guidance from the evolution of US-Iran tensions, actual navigation in the Strait of Hormuz, US inflation data for August, and the US Fed's policy path. [Platinum and Palladium Weekly Data Comments] COMEX platinum and palladium inventories showed divergent trends this week. The earlier consistent destocking trend for platinum inventories slowed down temporarily. Total inventory remained around 399,000 oz (August 6), with registered inventory accounting for about 48%, indicating significantly weakened destocking momentum. The key reason was that after a sharp price rebound (over 7% in a single day), industrial buying turned cautious, with market entry pace slowing down and low-price restocking demand receding. For palladium, the inventory buildup trend continued, with total inventory at about 255,000 oz (August 5), with registered inventory accounting for nearly 80%. Buffer stocks in US warehouses were near a one-year high, keeping the supply oversupply pattern unchanged. In terms of imports, platinum imports in June rose YoY again; palladium imports also picked up slightly, with the overall level significantly higher than from 2023 to 2025. China's platinum and palladium imports have grown rapidly since early 2026, and currently, domestic supply is relatively ample. Additionally, export restrictions on platinum and palladium make it hard to absorb the domestic surplus through exports. [Platinum Group Compounds] This week, chloroplatinic acid and palladium chloride were stable at first before rising sharply. In the early part, trading was weak due to downstream maintenance, but hydrogen energy demand provided some support for platinum-based compounds. Driven by soaring platinum and palladium prices overseas, domestic compound prices surged and hit recent highs, but actual downstream demand remained weak. Chloroplatinic acid and palladium chloride prices followed a two-stage trajectory this week, stable initially before surging. In the first stage, from July 30 to August 4, they mainly moved sideways in a narrow range. Chloroplatinic acid fluctuated narrowly around 162-167 yuan/g, and palladium chloride consolidated in the 187-191.5 yuan/g range. Spot market trading was sluggish, with high temperatures causing concentrated maintenance in automotive, pharmaceutical, and petrochemical sectors, which dragged down spot transactions. In the hydrogen energy sector, peak deliveries of hydrogen production equipment provided some support for platinum-based catalyst demand, with platinum compound deliveries slightly outperforming palladium. In the second stage, from August 5 to 6, prices surged violently. On August 5, chloroplatinic acid jumped to 177 yuan/g, and on August 6, it extended gains to 180 yuan/g, for a weekly change of 18 yuan/g, or a 11.11% weekly gain. Palladium chloride rose to 195.5 yuan/g on August 5, up 7 yuan/g, and then broke through 200 yuan/g to reach 204 yuan/g, for a weekly change of 17 yuan/g, or a 9.09% weekly gain, both hitting recent highs. This was mainly driven by the surge in overseas platinum and palladium, which transmitted to higher domestic raw material prices, boosting short-term bullish sentiment and pulling up compound raw material prices. However, from the overall downstream demand perspective, trading was quite sluggish, and demand continued to show a weak trend.
Aug 6, 2026 15:37 - [SMM Steel Market Morning News] The US Department of Homeland Security's series of negative measures concerning China seriously violated the important consensus reached by the heads of state of the two countries.
The negative China-related measures taken by the US Federal Communications Commission and the US Department of Homeland Security seriously violate the important consensus reached by the two heads of state and seriously undermine China’s legitimate rights and interests. On August 5, a spokesperson for the Ministry of Commerce stated that China has no choice but to respond with necessary countermeasures, including: strengthening export controls on drones and their key parts and technologies to the US, and suspending the China Compulsory Certification
Aug 6, 2026 09:13
Announcements
The data is planned to be officially launched in September 2026, at which time the new indicator names and IDs will be updated. The existing related data points will be discontinued on July 17, 2026.
DataJul 17, 2026 15:00To further enhance the accuracy and consistency of our data, our company has adjusted the calculation methodology for the tin import profit margin indicator:
DataApr 27, 2026 15:16Against this backdrop, SMM will begin publishing the US Midwest DDP aluminum premium starting February 27, 2026. Through daily market communication, SMM will introduce ......
PriceFeb 13, 2026 15:04
Events
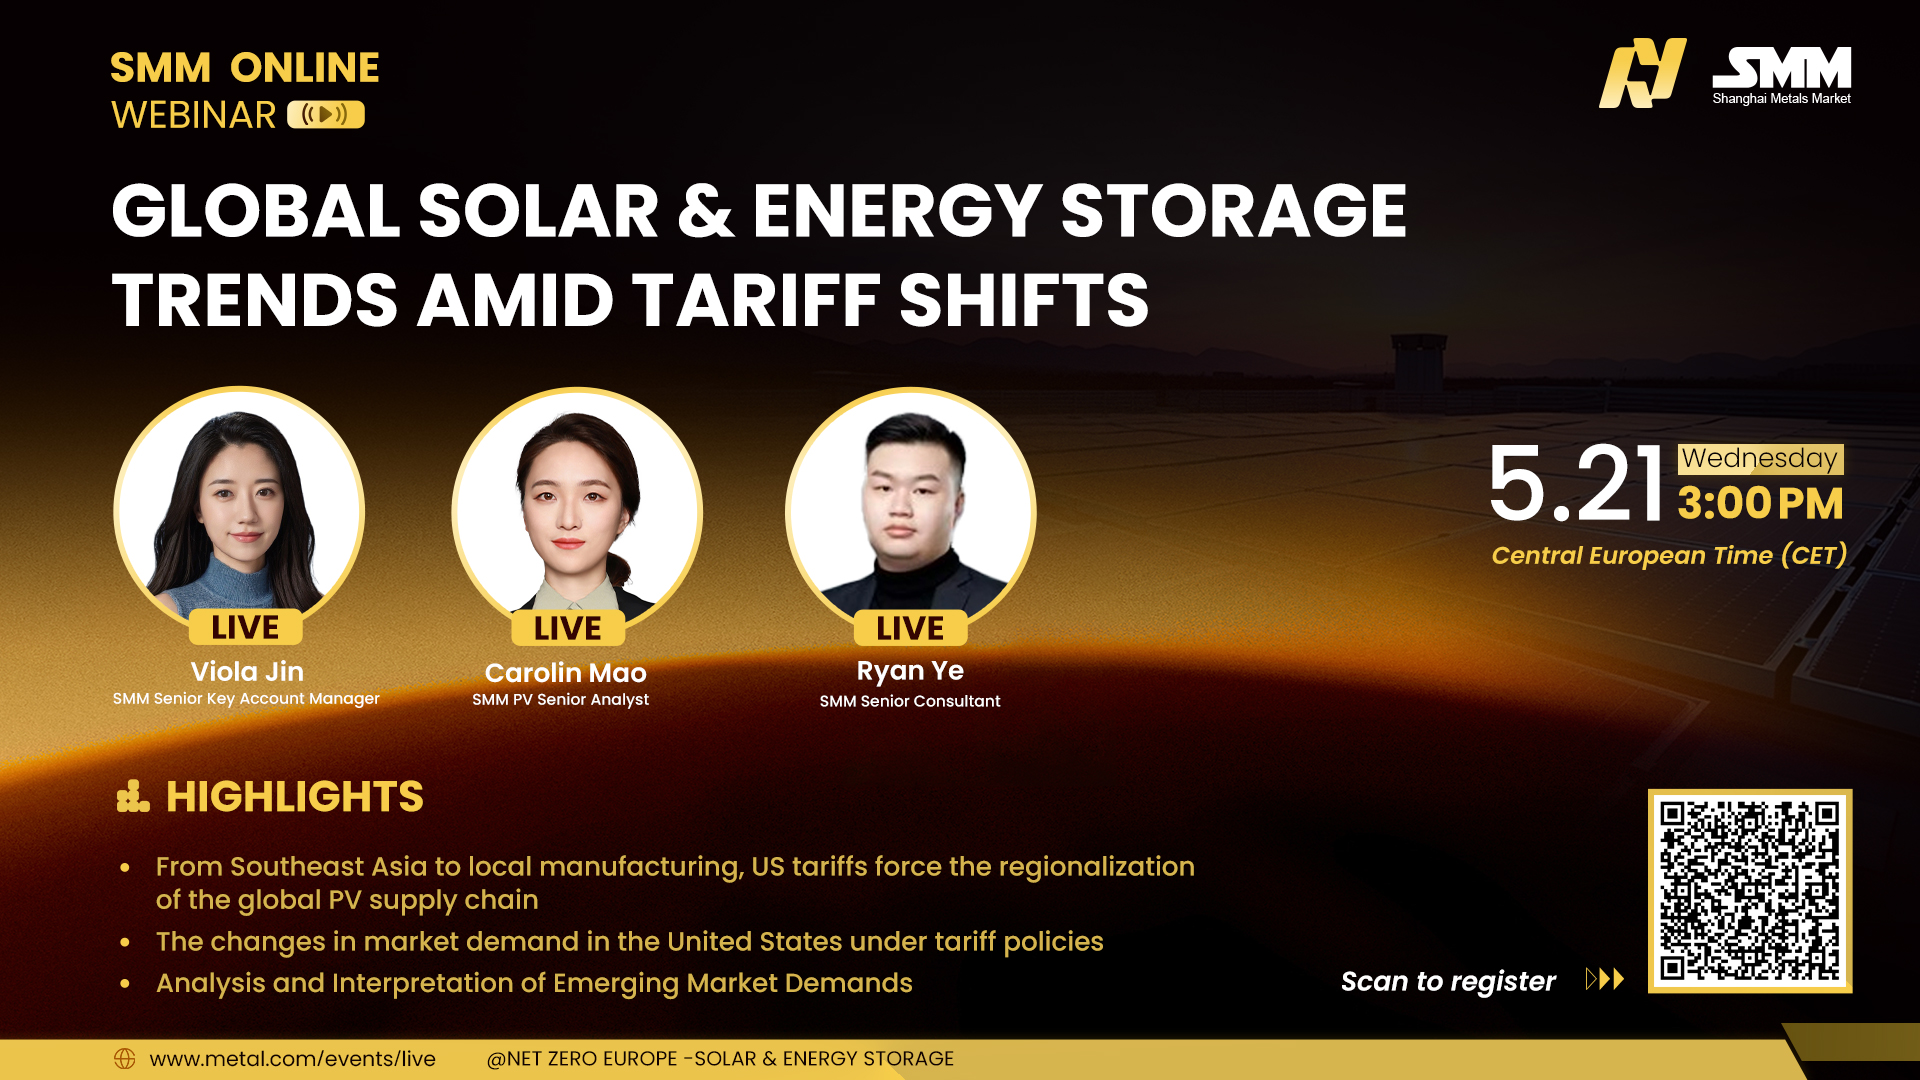 WebinarMay 21, 21:00 - 23:59 (GMT+8)
 WebinarApr 2, 17:00 - 23:59 (GMT+8)
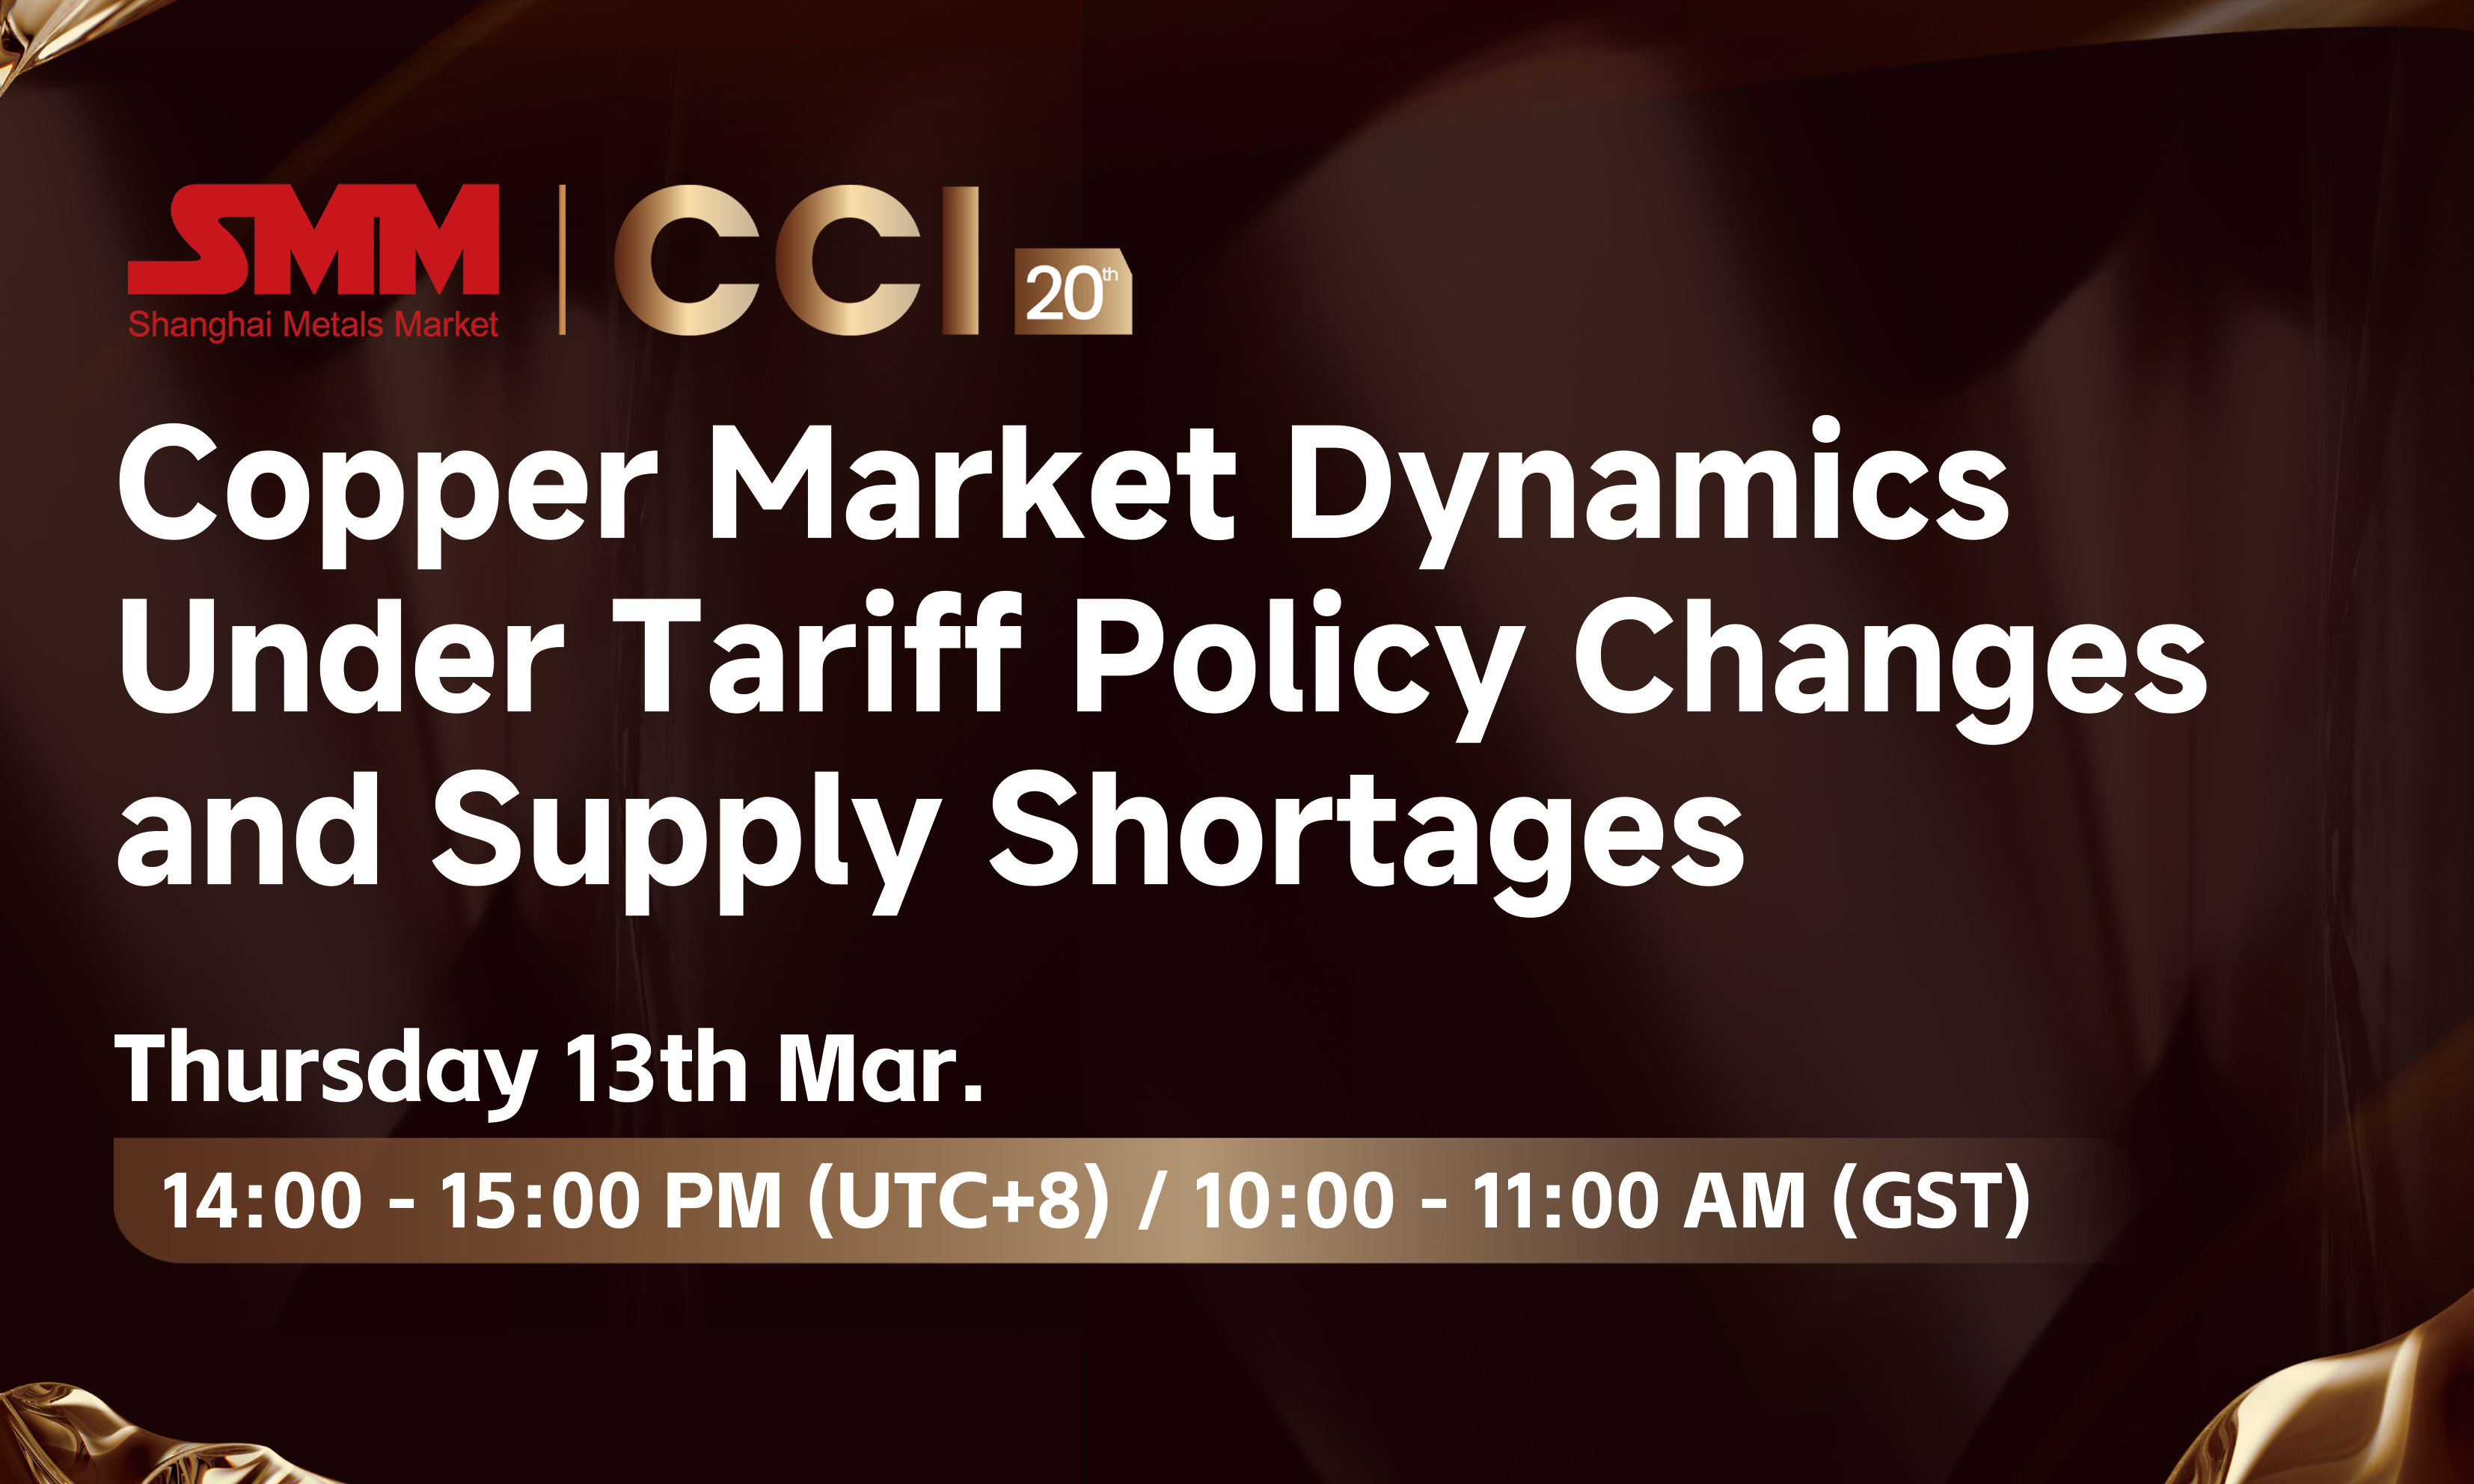 WebinarMar 13, 14:00 - 23:59 (GMT+8)