

590results found for 'processing fees'
Price
News
- [SMM Analysis] The Lithium Battery Consumption Tax Is Here—Who Will Foot the Bill?
Starting September 1, lithium-ion batteries will officially bid farewell to more than a decade of consumer tax exemption. The Ministry of Finance, the General Administration of Customs, and the State Taxation Administration previously issued a joint announcement, clarifying that a consumption tax will be reinstated on products such as lithium-ion batteries at a rate of 2%, and will be further raised to 4% starting September 1, 2027; meanwhile, cutting-edge technology routes such as sodium-ion batteries, solid-state batteries, and fuel cells will continue to be exempt through the end of 2028. After the news was released, the market’s first reaction was cost pass-through: if batteries are taxed, will NEVs become more expensive? Battery prices are highly likely to rise, and most of the incremental cost will also flow into the vehicle manufacturing stage, but that does not mean NEVs will therefore see broad-based price increases. Cost Increases May Not Necessarily Be Passed Through to Vehicle Prices From the tax calculation rules, this consumption tax will be levied as a one-off at the battery production stage, and the announcement has already made arrangements to avoid double taxation: where externally purchased, tax-paid battery cells are used for continuous production of battery packs, a credit is allowed for the tax already paid based on the quantity drawn for use in the current period; where self-produced battery cells are used for continuous production of battery packs, no tax is levied at the transfer stage either. Therefore, regardless of whether battery cells are self-produced or purchased externally, and regardless of who completes the Pack, the tax burden is ultimately levied once based on the taxable price at the battery pack ex-factory stage. Per-vehicle estimates should be calculated directly on a battery pack basis, rather than on a battery cell basis. Based on this approach, a rough estimate is that, using the price of a 100Ah LFP battery cell as a reference, for a mainstream BEV model equipped with a 60kWh battery pack, the 2% tax burden corresponding to the battery cell portion alone is about 400–500 yuan, which can be viewed as the lower bound; calculated on a battery pack ex-factory basis, the actual per-vehicle increment is mainly in the range of several hundred yuan to around 1,000 yuan. After the tax rate rises to 4% in 2027, the corresponding amount will double. The conclusion is that, compared with fluctuations in raw material prices such as lithium and nickel in recent years, the per-vehicle cost increment brought by this tax is not particularly significant; compared with sales promotions offered by automakers that often amount to several thousand yuan or even tens of thousands of yuan, its magnitude is likewise limited. Therefore, the consumption tax will raise vehicle costs, but is not enough to, on its own, constitute a reason for broad-based NEV price increases. The Tax Burden Is Highly Likely to Be Passed Downstream and Remain at the Automaker Level Where the tax burden ultimately settles depends on the bargaining power of each party across the industry chain. Considering upstream material supply and demand, the concentration of the battery industry, and communications with automakers, this tax is highly unlikely to remain with battery enterprises over the long term, and will instead move downstream along the industry chain into vehicle costs. First, there is limited room to shift it upstream For LFP, while the industry’s nominal capacity is not low, high-quality capacity such as high compaction density remains relatively tight, top-tier players have full order books, and processing fees are in a rising phase . Hunan Yuneng previously announced that it would raise processing fees across its full range of LFP products, and stated that incremental capacity would be difficult to meet all order growth. Under this supply-demand relationship, it is difficult for battery enterprises to demand that cathode material producers cut prices in reverse and jointly bear the consumption tax. The situation for ternary cathode material is somewhat different, but the conclusion is similar. Overall capacity for ternary cathode is in surplus, processing fees have long remained at low levels, and enterprises’ profit headroom has already been largely exhausted . Even if battery producers have some procurement bargaining power, upstream players lack sufficient profit buffers to fully absorb the 2% tax burden. Therefore, the cathode material side can at most share a small portion, and is unlikely to be the main segment under pressure. If the tax burden cannot move upstream, the next question is whether battery enterprises can pass it downstream. Previously, the market often cited “power battery overcapacity” as a reason to believe battery producers lack bargaining power versus automakers. But this judgment overlooks the highly concentrated structure of the power battery market. At present, the combined share of the Top 5 enterprises in China’s power battery installations has reached about 80% , indicating strong bargaining power. Although some second- and third-tier battery producers have weaker bargaining power and may ultimately bear most or even all of the tax burden, their corresponding market share is limited and cannot represent where the tax burden will settle for most industry installations. For external suppliers such as CATL, technical certification, car model fit, supply stability, and switching costs together constitute bargaining power; for vertically integrated enterprises such as BYD, when the battery segment transfers taxable batteries to the vehicle segment, the tax liability is triggered, and the consumption tax will be directly reflected as the group’s internal vehicle manufacturing cost. Based on information from enterprises, all parties are still negotiating the specific sharing ratio, but the direction of battery enterprises’ request to pass the burden downstream has already become relatively clear. Therefore, a more accurate conclusion is not that “all battery producers can pass the tax burden on,” but rather that the allocation of the tax burden will diverge significantly: top-tier players have the ability to pass most of the cost through to automakers, while second- and third-tier producers may be forced to bear a higher proportion themselves. Given that power battery installations are highly concentrated among top-tier players, on an industry-wide weighted basis, it is more likely that most of the tax burden will ultimately enter vehicle costs. Another often overlooked factor is exports. Under the current consumption tax regime, exported taxable consumer goods are exempt from consumption tax, and the scope of this announcement is also limited to domestic production and sales, toll processing, and imports; power batteries exported directly are not included in the tax base. For battery enterprises, the effective tax burden should therefore be assessed based on the domestic sales portion: taking CATL as an example, its overseas revenue share in 2025 had already exceeded 30%, and this part of the business is unaffected. The higher the export share, the lighter the effective tax burden and the thicker the profit buffer. This further reinforces the judgment that tax burden allocation will diverge—top-tier players not only hold bargaining power in the Chinese market, but their export mix is also diluting the tax base; those truly facing the full 2% tax base are precisely the second- and third-tier producers that rely mainly on domestic sales. Given the Current Competitive Landscape, Vehicle Prices Are Unlikely to Rise As mentioned earlier, the incremental tax burden for a mainstream BEV model is still only several hundred yuan to around 1,000 yuan. Compared with sales promotions that automakers often provide in the range of several thousand yuan or even tens of thousands of yuan, this magnitude is not enough to change pricing on its own. More importantly, the current NEV market has a dense set of substitute car models, and consumers are highly price-sensitive; if any automaker is the first to publicly raise prices, it may pay the price in sales and market share . Recently, automakers in China have still been offering end-user concessions of several thousand to tens of thousands of yuan through cash subsidies, trade-in benefits, and financing programs. Therefore, this cost is more likely to be absorbed by automakers through compressing per-vehicle margins, annual cost reductions, renegotiating prices for other parts, and adjusting marketing expenses. The eventual outcome may be: battery quotations rise, and vehicle costs also increase, but neither the official guidance price nor the end-user transaction price shows a broad-based increase directly triggered by the consumption tax. SMM New Energy Industry Research Lithium Battery End-User Analyst Fu Linqi 18122430020
Aug 17, 2026 18:24 - Macro Support Combined With Inventory Destocking, Aluminum Prices Drift Higher [SMM Aluminum Morning Meeting Minutes]
[Macro Support Combined With Inventory Destocking: Aluminum Prices Consolidate on a Strong Note] Overall, aluminum prices are expected to consolidate on a strong note in the short term, but upside room will be somewhat capped by expectations of production resumptions.
Aug 17, 2026 09:11 - China’s August Refined Copper Output Forecast to Fall Again as Feedstock Shortage Deepens
China’s refined copper output is expected to decline year on year for a second consecutive month in August as persistent shortages of copper concentrate and other smelter feedstocks continue to weigh on operating rates. State-backed research house Antaike forecasts August refined copper production at around 1.05 million tonnes among surveyed producers representing 81.97% of China’s total smelting capacity, down 2.83% year on year. July output from the same group is estimated at a similar 1.05 million tonnes, representing a 3.18% annual decline and falling short of an earlier forecast of 1.07 million tonnes. The expected contraction reflects increasingly tight availability of raw materials. Copper concentrate supply has remained under pressure for an extended period, prompting smelters to lower capacity utilisation as competition for feedstock intensifies. The strain is also visible in treatment charges. Processing fees for imported copper concentrate have remained negative for 19 consecutive months, while charges fell to a record low of around minus $175.7/t on August 7, compared with minus $38.4/t during the same period a year earlier. The deepening negative charges highlight the severity of competition among smelters for available concentrate. At the same time, tighter domestic tax-invoice regulations have constrained the supply of VAT-compliant recycled copper, reducing another important source of smelter feedstock and adding further pressure to refined output. The expected second consecutive annual decline in refined production suggests that prolonged concentrate tightness is increasingly translating into constraints on finished copper supply. With China accounting for a dominant share of global smelting capacity, continued feedstock shortages could further tighten refined copper availability and increase the market’s sensitivity to additional disruptions in concentrate supply.
Aug 17, 2026 05:21 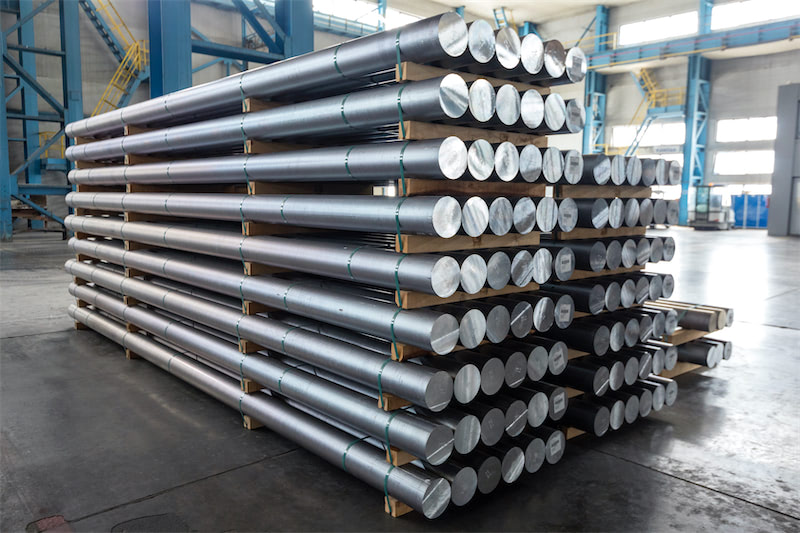 China Aluminum Billet Supply: July Extended the Inertia-Driven Uptrend; Expectations of a Retreat from Highs in August
SMM Aluminum Billet Market: In July, the operating rate of aluminum billet rose 1.1 percentage points MoM to 58.3%, up sharply by 5.2 percentage points YoY. Benefiting from the strong performance of aluminum billet processing fees in Q2...
Aug 15, 2026 19:09- Magnesium Ingot Weekly Price Rose, Upstream Support Strong, Downstream Follow-up Insufficient, Upside Room Limited [SMM Magnesium Weekly Data]
[Weekly Magnesium Ingot Prices Rise on Strong Upstream Support; Insufficient Downstream Follow-Through Limits Upside Room] This week, mainstream quotations for magnesium ingot in major producing areas were 15,900-16,000 yuan/mt, up 100 yuan/mt WoW, with FOB prices at $2,250-2,350/mt. This round of magnesium ingot price gains was driven by three factors: supply-side maintenance-related production cuts, cost push from coal and ferrosilicon, and concentrated delivery and restocking by traders. However, after the price increase, downstream fear of high prices emerged and transactions returned to mediocre levels; foreign trade remained weak, constrained by exchange rate fluctuations and the uncertain recovery of summer break orders. Upstream dolomite prices were stable, with sufficient supply from multiple channels; downstream magnesium powder and magnesium alloy prices followed the increase, but demand follow-through was insufficient. Magnesium alloy processing fees remained under pressure due to ample inventory, the impact of non-standard supply sources, high-temperature maintenance at die-casting enterprises, plastic substitution in two-wheelers, and other factors. In the short term, cost support is pitted against weak demand, and magnesium prices continue to move sideways.
Aug 14, 2026 18:01 - Antimony Price Center Continues to Rise [SMM Antimony Market Spot Weekly Review]
According to SMM data, the antimony market showed a stable-then-rise trend this week, with the price center continuing to move higher. The average price of #1 antimony ingot stabilized at 92,000 yuan/mt from Monday to Wednesday (Aug 10-12), was raised by 1,500 yuan/mt to 93,500 yuan/mt on Thursday (Aug 13), and remained unchanged on Friday. 99.8% antimony trioxide (domestic) largely moved in tandem, with its average price stabilizing at 82,000 yuan/mt from Monday to Wednesday, edging up by 500 yuan/mt to 82,500 yuan/mt on Thursday (Aug 13), and unchanged on Friday. The increase in antimony trioxide was noticeably smaller than that in antimony ingot, reflecting that downstream demand from flame retardants and other end uses improved but remained mild. In terms of pace, prices in the antimony products market mainly climbed steadily during this week's trading days; smelters generally held prices firm and held back from selling under loss-making pressure, and the market showed clear directional momentum. The mid-week rise was mainly driven by warming expectations of continued buyer stockpiling, but market participants widely reported that downstream rigid-demand restocking slowed noticeably and speculative interest also cooled, with overall market sentiment shifting to mildly bullish. Date #1 Antimony Ingot Lowest Price #1 Antimony Ingot Highest Price #1 Antimony Ingot Average Price Antimony Trioxide Lowest Price Antimony Trioxide Highest Price Antimony Trioxide Average Price Change 2026-08-10 (Mon) 91,000 93,000 92,000 81,000 83,000 82,000 Antimony +2,000 / oxide +1,000 2026-08-11 (Tue) 91,000 93,000 92,000 81,000 83,000 82,000 Unchanged 2026-08-12 (Wed) 91,000 93,000 92,000 81,000 83,000 82,000 Unchanged 2026-08-13 (Thu) 92,000 95,000 93,500 81,500 83,500 82,500 Antimony +1,500 / oxide +500 2026-08-14 (Fri) 92,000 95,000 93,500 81,500 83,500 82,500 Unchanged Weekly Average 90,500 92,900 91,700 78,750 81,400 80,075 Weekly +1.6% / +0.6% According to SMM estimates, China's antimony ingot production in July 2026, including antimony ingot, converted crude antimony, and antimony cathode, jumped about 30% MoM, showing a sharp increase. Customs data show that antimony ore imports from outside China in April, May, and June all exceeded 10,000 mt, and large ore imports inevitably translated into higher antimony ingot production. In H1 2026, cumulative antimony ore imports reached 59,347.5 mt in physical content, already exceeding total imports for full-year 2025. June antimony ores and concentrates imports were 10,688.6 mt, down 2.7% MoM from 10,980.1 mt in May, but still above the 10,000 mt mark. However, the previously market-worried "Spain variable" source is not sustainable. Combined with limited domestic mining output growth, the tight raw material pattern remained unchanged. Notably, a planned #1 antimony ingot smelting project with annual capacity of 10,000 mt in Xiaoerkule, Xinjiang may affect the future supply landscape. From a cost perspective, mining costs of some large producers' self-owned antimony ore plus smelting processing fees are now relatively close to spot prices, and smelters' willingness to hold prices firm and hold back from selling is highly consistent, which is also the core reason prices could sustain their uptrend this week. June antimony trioxide export volume was 474.3 mt, up 145.6% MoM from about 193 mt in May, with Russia as the top destination. Export channels showed a diversification trend, but total volumes remained low. Over the same period, unwrought antimony exports were zero, indicating antimony ingot exports were still restricted. The import structure shifted markedly, with Spain's share rising; export channels became more diversified, but total volumes remained low. Looking at Thai trade data, Thailand's antimony ingot imports in June were 1,405 mt, up 173.1% MoM and a half-year peak, sourced mainly from Vietnam, Myanmar, and Hong Kong; exports were 689 mt, up 132.1% MoM, mainly destined for Belgium, South Korea, and Japan. Thailand's industry chain pattern of processing antimony ingots into value-added exports to developed economies is clear, with export unit prices generally above import costs and a notable processing value-added effect. Data Indicator Latest Month Previous Month MoM Change Antimony ores imports (mt) 10,688.6 (Jun) 10,980.1 (May) -2.7% H1 cumulative antimony ore imports (mt in physical content) 59,347.5 - Exceeds full-year 2025 Antimony trioxide exports (mt) 474.3 (Jun) 193.2 (May) +145.6% Unwrought antimony exports 0 (Jun) 0 (May) Remained zero Antimony ingot production Jul +30% MoM Jun +30% Export controls continue. Since July 1, export controls on strategic minerals have been upgraded to "whole-supply-chain networked supervision"; compliant export channels have narrowed, which will further tighten domestic available supply. Although antimony trioxide exports rose sharply MoM, total volumes remained low compared with normal monthly exports of several thousand mt, and the industry chain's export willingness improved but the overall stance remained cautious. On end-use demand, as the traditional off-season draws to a close, operating rates across downstream sectors are expected to rebound steadily; for example, operating rates in the flame retardant and alloy sectors are expected to increase with the arrival of the September-October peak season. After earlier capacity contraction, the PV glass industry also has production resumption expectations, but demand for sodium pyroantimonate still needs to be observed and verified. Bromine prices rose to 36,500 yuan/mt on tightening supply and consolidated at highs, providing cost support for antimony prices. However, after restocking for rigid demand in the previous period, end-users now hold some raw material inventory and are not highly motivated to continue restocking in the near term. From this week's antimony trioxide transactions, downstream acceptance of high-priced antimony trioxide supply remained cautious, and there was some resistance in passing this through to the upstream smelting segment. This was also an important reason why this week's antimony price rise was measured and lacked momentum for a one-sided sharp rally. For example, sodium pyroantimonate production in July fell 20% MoM, and two consecutive months of decline showed that the peak demand season had not arrived. From this week's trend, the pace of price increases reflected the market's core contradiction: a game between smelters' willingness to hold prices firm and downstream acceptance of high prices. Looking ahead to next week, the core logic supporting antimony prices remains solid: smelters generally face loss-making pressure from inverted prices of externally purchased raw materials and finished products, and their willingness to hold prices firm and hold back from selling is highly consistent; meanwhile, the approaching September-October peak season is further strengthening downstream expectations of future restocking. Next week, antimony prices are expected to hold up well. Given that current gains are relatively mild and upward momentum still needs to accumulate, the probability of a sustained one-sided sharp rally is low. Attention should be paid to downstream actual acceptance of cargoes after price increases. In the medium and long term, over the next month, the antimony market is expected to continue its firm pattern as peak-season demand materializes. Late Q3 to early Q4 is the traditional peak consumption season for antimony products; the flame retardant industry entering its production peak will boost consumption of antimony trioxide and antimony ingot, and the PV glass industry has production resumption expectations. On the supply side, China's antimony ore is constrained by resources and can hardly see significant volume growth; export controls continue to deepen, and the price center is expected to rise gradually. Key Points to Watch: - Downstream actual acceptance of antimony ingot prices after increases and the sustainability of transaction volume expansion - Changes in Antimony Oxide Capacity Outside China and China's Export Recovery Progress - Actual Verification of "September-October Peak Season" Demand - Subsequent Changes in Antimony Ore Imports - Progress on the 10,000 mt Antimony Ingot Smelting Project in Xiaoerkule, Xinjiang - Bromine Price Trend and Cost Support - Enforcement of Strategic Mineral Export Control Policies
Aug 14, 2026 14:56
Announcements
The data is planned to be officially launched in September 2026, at which time the new indicator names and IDs will be updated. The existing related data points will be discontinued on July 17, 2026.
DataJul 17, 2026 15:00SMM will launch a new 9-Series NCM Cathode Material (For CE) price effective July 1, 2026, benchmarked against the 900604 and 900505 models to provide price guidance for consumer market.
PriceJun 26, 2026 17:39SMM will introduce Southeast Asian 6063 Aluminum Billet Premiums, SMM Southeast Asian 6063 Aluminum Billet, and CIF Southeast Asia 6063 Aluminum Billet price points starting 3rd July 2026.
PriceJun 26, 2026 13:49