

12560results found for 'Tin'
News
- [SMM Stainless Steel Market Flash] Outokumpu: Freight and Fuel Costs Are Eating the Gains From EU Trade Measures
Outokumpu's chief financial officer Marc-Simon Schaar said on July 30 that while EU trade measures are lifting demand for European steel production, higher costs for scrap, freight and fuel are consuming the improvement. The Finnish stainless producer's European business posted adjusted core profit of €17 million in the second quarter, recovering from a €13 million loss in Q1 but barely above the €16 million earned a year earlier. Schaar said stronger demand for local output has also sharply raised demand for scrap, the main raw material for European mills, while subdued end-user demand has cut scrap generation and pushed raw material prices above last year's levels. State aid worth roughly €35-40 million a year to offset EU emissions trading costs has also ended.
Jul 31, 2026 18:54 - [SMM Stainless Steel Market Flash] India's Jindal Stainless Wins Three Quality Awards at TQM Convention 2026
Jindal Stainless, India's largest stainless producer, said its Jajpur plant in Odisha won three awards at the 2026 Total Quality Management Convention held by the Quality Circle Forum of India's Pune chapter. Two gold awards went to projects optimising manganese recovery in 200-series melting at the AOD shop and reducing RIS defects in 300-series at the hot strip mill, with a silver award for reducing trapezoidity in grades 304 and EN 1.4307. The convention drew 132 teams from close to 30 companies. Jindal held annual melting capacity of 4.2 million tonnes as of March 2026 across 16 facilities globally, including Spain and Indonesia, on FY26 turnover of ₹429.55 billion, about $4.86 billion.
Jul 31, 2026 18:52 - [SMM Stainless Steel Market Flash] Aperam Says European Margins Were €75/t Before EU Trade Measures
Luxembourg-based stainless producer Aperam told its Q2 2026 earnings call that its European business was already earning about €75 a tonne before the EU's new trade defence measures took effect, and that it welcomes the rules as strengthening the European steel community rather than as a disruption — a framing that differs from peers attributing recovery chiefly to import curbs, with Aperam stressing its diversified portfolio instead. Adjusted EBITDA was €130 million in Q2. The company guides Q3 adjusted EBITDA and shipments lower on seasonality and the absence of valuation effects, with net financial debt flat in Q3 and falling by year-end. Full-year capex guidance is about €200 million, back-end loaded, with the base dividend held at €2.00 a share.
Jul 31, 2026 18:51 - [SMM Stainless Steel Market Flash] Aperam Posts Best Quarter in Four Years With Q2 EBITDA of €130M on Brazil and Alloys
Luxembourg-based stainless producer Aperam reported second-quarter 2026 adjusted EBITDA of €130 million on July 30, up about 44% from €90 million in Q1 and its strongest quarter in four years, beating company-compiled consensus of €121 million. Net income rose sharply to €116 million. Management said every segment contributed, with Brazil returning to full seasonal strength and the Alloys and Specialties unit reinforced by the Magnetec Group acquisition, while ramp-up in innovation products such as electrical and electronics steels and OLED materials offsets Aperam's limited oil and gas exposure relative to peers. Capex was €24 million and dividends paid €36 million in the quarter. Shares fell about 4% after the release.
Jul 31, 2026 18:51 - [SMM Analysis] Evolution of NEV Battery Pack Integration Technology: From CTM to CTP to CTB/CTC
In recent years, the official figures for NEV driving range and battery energy density have been continuously refreshed. However, many may not realize that these improvements do not entirely stem from breakthroughs in electrochemical systems—iterations in cathode materials, anode materials, and electrolytes often take years. More direct changes have occurred at the structural level inside battery packs. CTM, CTP, CTB, and CTC represent several technological routes where battery integration levels continue to increase. Their common logic is simple: reduce intermediate layers to "stuff" the battery more tightly into the auto body. But the trade-offs between space utilization, manufacturing cost, and repairability vary from one generation to the next. 1. CTM (Cell to Module): The Traditional "Layered Doll" Approach In the early stages of NEV development, battery pack assembly followed a relatively conservative approach. Battery cells were first assembled into modules, the modules were then arranged into a battery pack, and finally, the battery pack was fixed under the vehicle floor. Battery cell → module → battery pack → auto body formed four independent layers. The pros and cons of this solution were clear. The advantage was repair convenience—a faulty module could be replaced individually without touching the entire battery pack. Simultaneously, the module casing provided additional protection for the cells, leading to relatively mature structural safety. But the cost was just as direct: module casings, connectors, and cooling pipes took up significant space, resulting in a space utilization rate of only about 40% inside the battery pack. This meant that, for the same volume, the CTM solution could hold the fewest battery cells, limiting its driving range potential. CTM was the industry's default choice for a long time because it aligned with the traditional automotive supply chain's division of labor—battery enterprises supplied modules, and automakers handled integration. But this division also created a structural ceiling: the volumetric utilization rate of the battery pack was difficult to break through. 2. CTP (Cell to Pack): Eliminating the "Middleman" The core modification in CTP was skipping the module layer, allowing cells to directly form the battery pack; space utilization improved from around 40% to over 70%. Simultaneously, by reducing module casings, connectors, and fasteners, the number of battery pack parts decreased, leading to lower manufacturing costs. Two different technological choices for CTP implementation existed in the industry. One was the thoroughly module-free solution represented by BYD's blade battery. By shaping cells into long strips and arranging them directly into the battery pack, supported by a honeycomb-like structure, it enhanced space utilization while also assuming some structural functions. The other was the highly integrated solution represented by CATL's CTP 3.0 (Qilin battery). It combined cells with multi-functional elastic interlayers into integrated energy units and integrated components like crossbeams, longitudinal beams, water-cooling plates, and thermal pads to further optimize internal layout and thermal management. The Qilin battery achieved a volumetric utilization rate of 72% and a system energy density of 255 Wh/kg. From a market penetration perspective, CTP has achieved a dominant mainstream position. Mainstream NEV manufacturers in China have launched mass-produced car models equipped with CTP solutions, ranging from independent brands to joint ventures, covering a broad price range from entry-level to high-end products. Meanwhile, the market share of traditional CTM solutions continues to shrink, currently remaining only in some micro-vehicles or specific export models. Overall, CTP has become the most prevalent battery integration technology route at the current stage. 3. CTB and CTC: The Battery Becomes Part of the Auto Body The concept behind CTB (Cell to Body) is to merge the battery pack's top cover with the vehicle floor. Cells are installed directly onto the vehicle floor, eliminating the need for a separate battery pack top cover. One of the main benefits of this solution is freeing up vertical space, allowing for a more spacious cabin or creating conditions to lower the vehicle's stance. Simultaneously, when the battery pack participates in bearing vehicle loads, torsional stiffness can increase by over 70%. BYD's Seal series and Xiaomi's Pengcheng series are representative models featuring CTB solutions. BYD officially announced that the Seal's body torsional stiffness reached 40,500 N·m/°. Xiaomi Auto announced a CTB battery volumetric efficiency of 77.8%. CTC (Cell to Chassis) goes a step further, integrating the battery system more deeply with the chassis or underbody, further blurring the structural boundary of the battery pack as an independent assembly. In some solutions, the battery system is also integrated collaboratively with thermal management, electric drive, and high/low-voltage control modules. Representative examples of this approach include the Tesla Model Y (Texas factory version) and the Leapmotor C10 equipped with the CTC 2.0 Plus solution. The technical goals of CTB and CTC are aligned—exchanging space utilization and body stiffness through structural integration. The difference between the two routes is more apparent in engineering implementation: CTB simplifies on top of the existing body architecture, retaining a relatively independent chassis frame; CTC treats the chassis and battery as a single whole from the outset, placing higher demands on the vehicle platform's upfront definition. Market data indicates that while CTB and CTC are still in the relatively early stages of penetrating from the high-end to the mass market, this technological route has begun to filter down to lower price brackets. The 2026 MG4 brought CTB technology down to the price range of 60,000 to 100,000 yuan, showing that structural integration solutions are no longer exclusive to high-end car models. Concerns Over Structural Integration Solutions The most direct challenge facing CTB and CTC structural integration solutions is repair economics. In traditional CTM solutions, some faults could be repaired by replacing the module. After CTP eliminated modules, the battery pack could usually still be removed as an independent assembly, but the smallest repairable unit and repair difficulty on-site depended on the specific structure. CTB and CTC, however, further increase the degree of integration between the battery and auto body, potentially increasing the difficulty of disassembly, detection, and damage assessment. According to industry estimates, the single-occurrence repair cost for a CTB/CTC solution is 3 to 5 times that of a CTP solution under the same damage conditions. This poses new challenges for insurance companies, the repair system, and the residual value management of used cars. Currently, some automakers, when promoting CTB solutions, simultaneously launch supporting services like "battery-body integrated warranty" or "chassis armor" to alleviate consumer concerns, but this issue has not yet formed a standardized solution at the industry level. Additionally, CTB and CTC solutions demand significantly higher vehicle manufacturing precision and after-sales detection equipment. Once the battery is integrated with the body, the removal process involves disassembling and reassembling structural body parts, requiring potential upgrades to traditional 4S shops' repair equipment and technical capabilities, involving the restructuring costs of the entire after-sales system. Evolutionary Direction From CTM to CTP, and then to CTB and CTC, the evolutionary direction of battery pack integration technology is clear—fewer layers lead to higher space efficiency and greater body stiffness. This is a forward path driven by space efficiency and manufacturing costs. But this trend is not a linear acceleration. For CTB and CTC to achieve large-scale adoption, besides engineering breakthroughs, simultaneous progress is needed in supporting systems like repair standards, insurance pricing, and used car evaluation. Based on current industry data, CTP will continue to hold its mainstream position, while the penetration rate of CTB/CTC will depend on two variables: the degree of standardization in structural integration solutions and the pace at which repair costs and insurance systems adapt.
Jul 31, 2026 18:51 - Global Trade Growth Exceeds Expectations in Q1 2026, Driven by AI Components and Asian Economies
[SMM Aluminum Express] The World Trade Organization released the latest data showing that global merchandise trade growth in Q1 2026 exceeded expectations. Trade in AI-related electronic components surged, offsetting the negative impact of the Middle East war in the final month of the quarter. On a seasonally adjusted basis, global merchandise trade volume in Q1 this year was up 1.9% QoQ and up 3.2% YoY. Asia's exports and imports in Q1 rose 12.9% and 14.6% YoY, respectively, driven mainly by economies such as China, Singapore, South Korea, and Thailand. North America's exports rose 7% YoY, while imports fell 10.7% YoY. The WTO expects trade data for the next quarter to more fully reflect the trade disruptions in the Strait of Hormuz.
Jul 31, 2026 18:44
Announcements
SMM will launch a new price for Battery-grade Nickel Sulphate, CIF China, USD/wmt, starting August 7, 2026.
PriceJul 30, 2026 18:07SMM announces the discontinuation of updates and new data for non-oriented silicon steel FOB price points and database, due to strategic adjustments and to maintain price accuracy
PriceJul 29, 2026 11:16SMM plans to add the SMM FOB Middle East Sulfur price point starting from August 7, 2026 (Friday).
PriceJul 29, 2026 09:43
Events
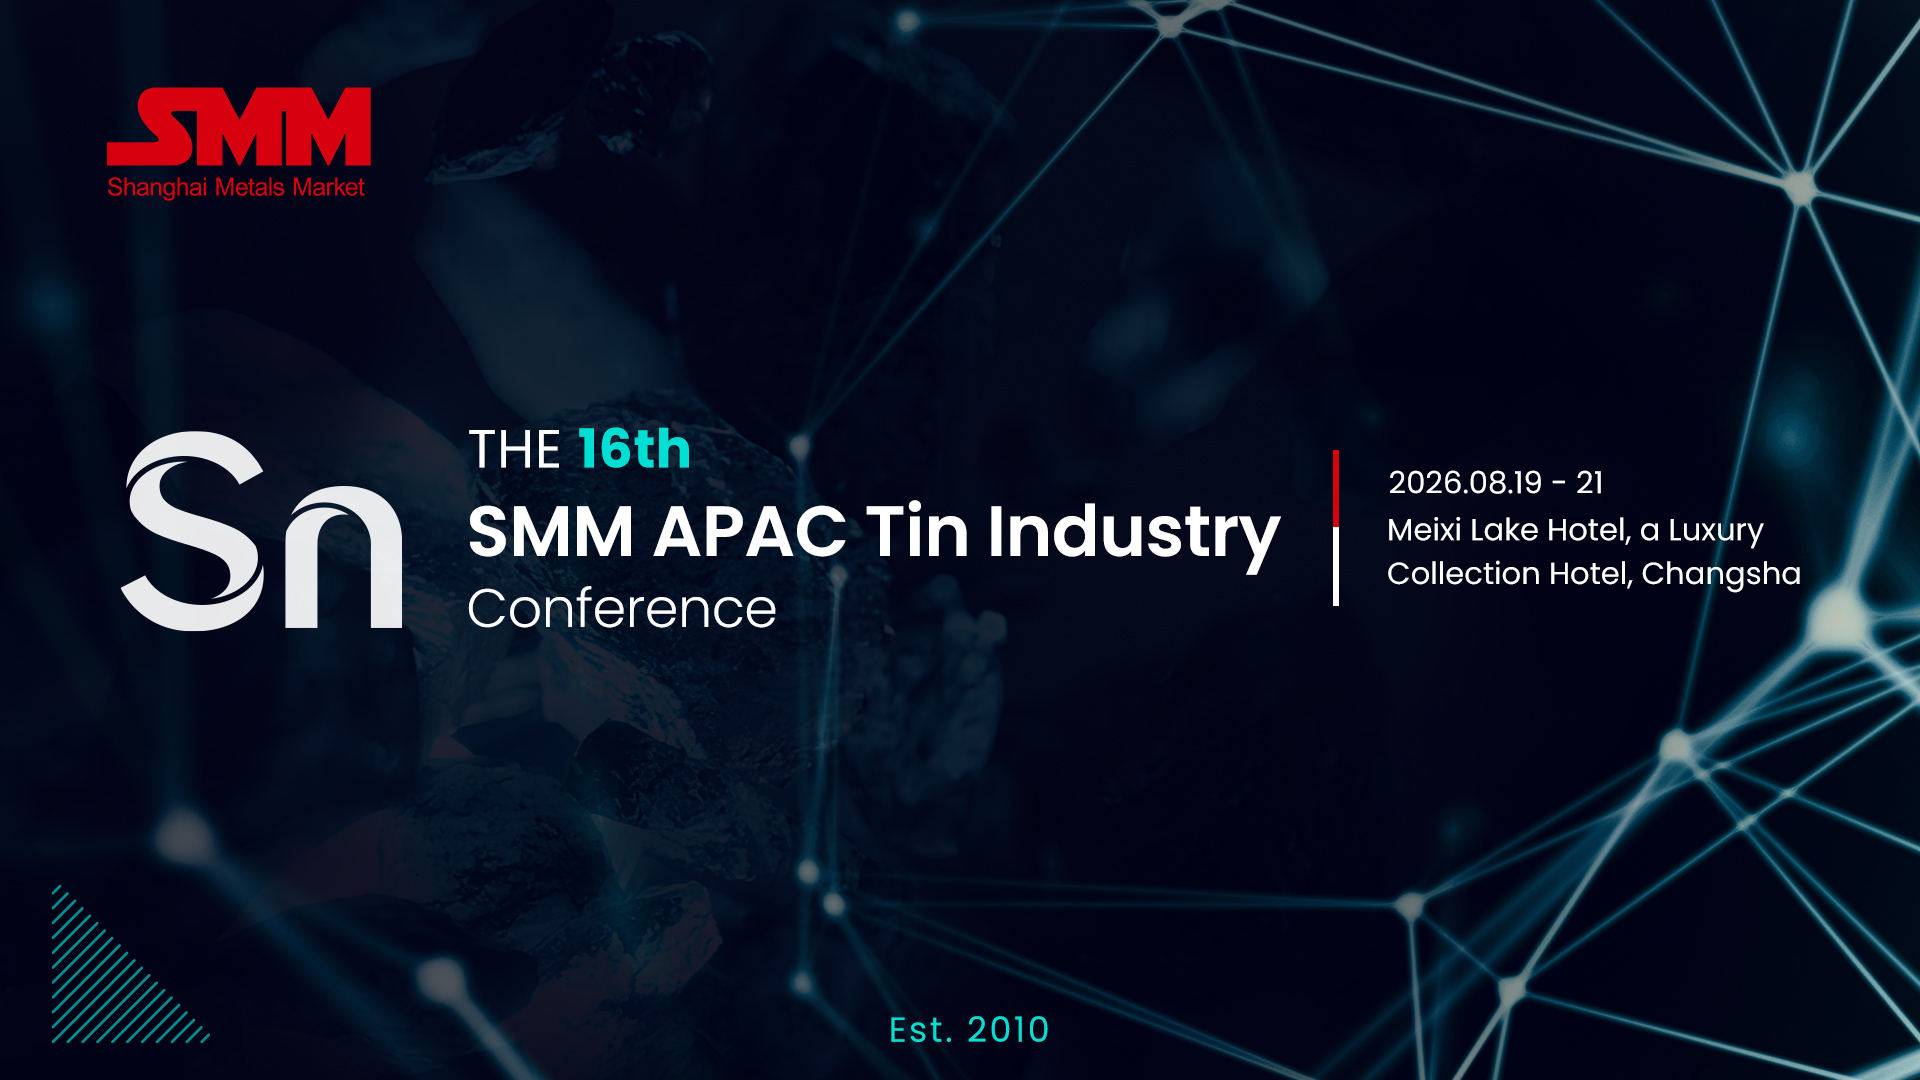 EventsAug 19 - 21, 2026 (GMT+8)Meixi Lake Hotel, a Luxury Collection Hotel, Changsha, China
 WebinarJul 1, 16:00 - 23:59 (GMT+8)
 WebinarApr 14, 16:00 - 23:59 (GMT+8)