

767results found for 'Southeast Asia'
Price
News
- [SMM Analysis] H1 2026 Review of the Copper Scrap Market Outside China: Copper Prices Surged, Tight Raw Material Supply Supported Firm Discounts
[SMM Analysis: H1 2026 Review of the Overseas Copper Scrap Market: Copper Prices Surge, Tight Raw Material Supply Supports Firm Discount] In Q1 2026, copper prices stayed high and consolidated around $13,000/mt. It was not until late Q1 that a short-term correction emerged, but prices resumed their uptrend in Q2 and continued to hit new record highs. Behind this, tight copper ore supply provided support on one hand; on the other, the siphon effect on global copper resources triggered by US tariff expectations further amplified market concerns over the supply side. At the same time, rapid growth in new copper-consuming sectors such as NEVs, new energy power, power grid construction, and data centers fueled rising expectations for copper demand. Against the backdrop of supply growth failing to match demand growth, copper prices received strong support. The tight supply of copper units also prompted enterprises to shift their focus from the ore side to supplementary sources beyond mine supply, with copper scrap gaining noticeably in importance. As copper prices continued to surge, copper scrap prices rose in tandem, while structural changes arising from copper resource scarcity began to alter the pricing logic of the copper scrap market, which had previously been dominated by consumption and price differentials.
Jul 7, 2026 18:11 - [SMM Analysis] Volume Continues to Grow While Structure Undergoes Deep Adjustment — Review of H1 2026 EV Market
1. NEVs: Domestic Sales Growth Under Pressure, Exports Surge In H1 2026, global NEV sales reached approximately 10.25 million units, a cumulative 14% YoY increase; China’s NEV sales totaled about 7.4 million units, up 7% YoY cumulatively, with an average penetration rate of around 48%. While total volume kept growing, the mix of domestic sales and exports diverged markedly. In the Chinese market, domestic sales accounted for about 69% of the total, with cumulative volume falling 14% YoY and the monthly penetration rate peaking at 62%. China’s NEV market has entered a high-base mature stage. The rush to buy ahead of the expected subsidy reduction at the end of 2025 pulled forward some demand that would have occurred in early 2026. Pushing the penetration rate beyond 60% is now encountering considerable headwinds—the remaining internal combustion engine vehicle users are mostly those with limited charging access, rigid long-distance travel needs, or high price sensitivity, making their conversion significantly harder than that of early adopters. Domestic demand is in a transitional phase shifting from policy-driven to market-driven growth. Exports, on the other hand, accounted for about 31% of China’s NEV sales in H1 2026, a sharp jump from 15% in H1 2025, with cumulative volume surging nearly 120% YoY. Three drivers fueled this export surge. First, a low base effect magnified the YoY growth: exports in H1 2025 were artificially suppressed by the EU anti-subsidy probe, creating an unusually low base. Second, automakers rushed to export ahead of tariff implementation, opening a temporary export rush window. Third, Chinese NEVs’ product competitiveness in emerging markets such as Southeast Asia and Latin America continued to improve; coupled with rising fuel vehicle operating costs outside China due to shifting international dynamics, this stimulated the release of overseas NEV demand. From a technology perspective, BEV models accounted for about 66%, basically flat from a year earlier. Beneath this “frozen” share, two opposing forces are at play. On one hand, as NEVs penetrate into lower-tier cities, inadequate charging infrastructure makes plug-in hybrid and extended-range models, which can run on both electricity and fuel, still the most practical choice. On the other hand, the popularization of 4C fast charging technology and the expansion of ultra-fast charging networks are gradually addressing the range anxiety weakness of BEVs, building momentum for a rebound in their market share. I. Vehicle Battery Capacity, from January to May the average capacity reached 68.4 kWh, up 34% YoY. The growth drivers were concentrated in three aspects: first, consumption structure upgrades, with the trade-in policy steering demand from A00/A0 to B- and C-class models—larger models carry higher-capacity batteries, and this structural effect lifted the overall average; second, the battery capacity of plug-in hybrid and extended-range models continued to expand, with all-electric driving range rising from 50–80 km to 150–250 km and corresponding battery capacity roughly doubling from 8–18 kWh to 18–40 kWh, while extended-range models grew to over 50 kWh; third, the share of commercial vehicles increased, and the vehicle battery capacity of heavy trucks and logistics vehicles generally exceeded 200 kWh, exerting a notable leverage effect on the overall average. 2. Power Battery Installations: Growth Shift, Bottoming Out in Q2 In H1 2026, China's power battery installations are estimated at around 340 GWh, up 10% YoY. Q1 was dragged by soft domestic sales and subsidy phase-out, keeping growth sluggish; Q2 saw a month-on-month recovery, with May installations reaching 71.9 GWh, a new high for the year, signaling a gradual repair in end-use demand. In the global market, H1 installations are estimated at about 580 GWh, up roughly 15% YoY, with incremental volume outside China mainly coming from the acceleration of electrification in Europe and continued ramp-up in emerging markets such as Southeast Asia and Latin America. Notably, growth outside China has outpaced the Chinese market—Q1 installations outside China reached 117.4 GWh, up 17.4% YoY, and the combined market share of Chinese enterprises in markets outside China rose to 52%. A shift in growth driver—where the Chinese market downshifts and markets outside China take over—is becoming a new feature of the industry’s growth structure. 3. Power Battery Cell Production: Strengthened LFP Dominance and Analysis of the Gap Between Production and Installations In H1 2026, China's total power battery production was about 790 GWh, with cumulative YoY growth of 43%; global power battery cell production totaled about 860 GWh, with cumulative YoY growth of 31%. In the Chinese market, LFP power battery cell share rose to 76% from 66% in the same period of 2025, with production up 64% YoY; ternary power battery cell share was around 24%, basically flat YoY. LFP’s share rose from 66% to 76%, driven by three key factors. First, the electrification ramp-up of commercial vehicles provided the most direct incremental contribution. Commercial vehicles almost entirely adopted the LFP route; heavy trucks, logistics vehicles, and buses place far higher demands on cost and safety than on energy density. The structural growth in commercial vehicle installations directly boosted LFP’s overall share. Second, the penetration rate of LFP in the passenger car segment continued to rise on its own. Extended-range and plug-in hybrid models naturally favor the LFP route, while the maturation of 4C fast-charging LFP solutions effectively addressed the range anxiety shortcoming, further squeezing the market space for mid-end ternary batteries. Third, the explosion in energy storage demand created a siphoning effect on LFP production lines. LFP production lines can flexibly switch between EV and ESS, and the high growth in energy storage orders drove LFP line operating rates significantly higher than those of ternary lines. Strengthened economies of scale further lowered costs, forming a positive feedback loop. There was a notable growth gap between power battery cell production (790 GWh, +43%) and installations (approximately 340 GWh, +10%), but this did not stem from inflated demand. Rather, it resulted from the combined effect of the following factors: First, export diversion—about 30% of production flowed to markets outside China either as complete vehicle exports or direct battery cell exports, and was not included in domestic installation statistics. Second, timing mismatch—some battery cells whose production schedules were accelerated in Q2 were still in inventory or in transit and are expected to translate into installations in H2. In addition, after the destocking cycle in H2 2025, battery cell manufacturers’ finished product inventory cycle was compressed from 2 months to 1.3 months, and there was active restocking in H1 2026. Overall, the high production growth reflected the buoyancy of battery enterprises’ production activity, while the slower installation growth was more affected by export diversion and inventory cycle disruptions. The gap between the two does not represent a substantive deterioration in the supply-demand relationship. 4. Cost Changes In H1 2026, prices of key raw materials for power battery cells rose overall. Unlike the previous cycle of soaring lithium prices, top-tier players’ cost control methods during this price rise were more diverse. As lithium carbonate futures trading matured, battery and cathode material enterprises hedged to lock in procurement costs ahead of time, effectively offsetting spot price fluctuations. Some long-term contract orders adopted formula pricing, allowing for smoother price transmission. Coupled with the ongoing large-scale centralized procurement of auxiliary materials and technological cost reductions, the increase in cost per Wh for mainstream battery cell enterprises remained generally manageable. However, as the industry was still in a price war, involution kept the overall gross margin of the industry at a relatively low level. H2 Outlook Looking ahead to H2 2026, the power battery cell industry is expected to sustain the growth momentum seen in H1, as recovering domestic demand and strong export performance reinforce each other, with the full-year trajectory trending lower in H1 and higher in H2. Sales side, the auto market is likely to stabilize in Q3, followed by the traditional peak season in Q4. Alongside the gradual absorption of the pull-forward effect from 2025, the decline in domestic sales is expected to continue narrowing. On the export front, although tariff policy uncertainty persists, the product competitiveness of Chinese NEVs in markets outside China has become entrenched. Demand in emerging markets such as Southeast Asia, Latin America, and the Middle East continues to accelerate, and proactive restocking by overseas dealers points to a high probability that strong export growth will persist in H2. Installations side, although the growth rate has come down significantly from 2025 levels, absolute incremental volume remains substantial, supported by both rising vehicle battery capacity and the ramp-up of commercial vehicle volumes. H2 installations are projected to rebound markedly from H1, and the structure—passenger vehicles providing the base and commercial vehicles contributing incremental elasticity—will remain unchanged. Notably, the inventory buffer built up from production significantly outpacing installations in H1 will gradually flow into installations in H2, offering additional support to H2 data. Overall, the power battery cell industry in 2026 has left behind the era of systemic growth dividends and officially entered a phase of deep divergence. Sustained high export growth opens new growth avenues for Chinese battery enterprises, but the decisive factor in the second half of the competition will be whether they can truly seize the window of opportunity in overseas markets and secure a firm foothold in the global supply chain.
Jul 7, 2026 11:10 - [SMM Rebar Production Schedule] Worsening Losses and Off-Season Demand Push July Building Materials Planned Production Further Down
In July, the planned rebar production was 7.428 million mt, down 389,700 mt from June's actual production, a decrease of 4.98%. Average daily output of rebar in July stood at 239,600 mt, down 8.05% MoM. In July, the planned wire rod production was 3.197 million mt, up 18,700 mt from June's actual production, an increase of 0.59%. However, the average daily output of wire rod in July was 103,100 mt, down 2.66% MoM. In July, the sample steel mills' long product export schedule reached 653,000 mt, down 41,000 mt MoM. Among this, the steel billet export schedule was 350,000 mt, down 30,000 mt MoM.
Jul 6, 2026 16:12 - [SMM PV News] Gokin Solar Scenario Solutions Debut at ASEW 2026, Promoting Sustainable Energy Innovation Through Partnership
From July 1 to 3, ASEAN Sustainable Energy Week 2026 was held at the Queen Sirikit National Convention Center in Bangkok. As a leading energy industry event in Southeast Asia in terms of scale and influence, this year’s exhibition, themed “Driving Sustainable Energy Innovation through Regional Partnerships,” brought together energy investors, EPC contractors, and upstream and downstream enterprises along the industry chain from ASEAN countries to explore regional low-carbon transition development paths. Gokin Solar showcased a range of high-efficiency modules and its core wafer product portfolio, offering PV solutions covering multiple scenarios to closely align with local market demand, deepen regional partner collaboration, and further solidify its strategic presence in the Southeast Asian market.
Jul 6, 2026 14:36 - [Vietnam terminates Thach Khe iron ore project, shelving major upstream development]
Vietnam’s Ha Tinh Province has officially terminated the Thach Khe iron ore mining project and revoked the project’s investment certificate, according to media reports. The project had been suspended for several years and was operated by Thach Khe Iron Joint Stock Company. Located in Ha Tinh Province, the mine has reserves of around 544 million tonnes and is considered one of the largest iron ore mines in Southeast Asia. Local authorities have assigned relevant departments to handle follow-up matters related to land, finance, assets and other obligations. The termination suggests Vietnam is unlikely to improve domestic iron ore supply through this major project in the near term, limiting local raw material self-sufficiency.
Jul 6, 2026 13:32 - [MinebeaMitsumi to Increase Production of Bearings for AI Data Centers]
According to a Nikkei report, as AI-driven demand increasingly extends from semiconductors to a broader range of electronic components, MinebeaMitsumi will invest ¥58 billion (approximately $360 million) to expand capacity for precision bearings used in cooling equipment and storage devices for AI data centers. The Japanese manufacturer plans to raise its total bearing capacity by about 30% to over 500 million units per month through investments at its Southeast Asian production sites. The company plans to introduce advanced equipment that can boost production efficiency by about 60%, with construction expected to begin this year and production potentially starting as early as fiscal 2028.
Jul 6, 2026 11:25
Announcements
SMM will launch new import and export price assessments for billets in the Black Sea, Philippines, and Turkey, effective from 13 July 2026, to better reflect market dynamics and support global trade.
PriceJul 2, 2026 14:22SMM will introduce Southeast Asian 6063 Aluminum Billet Premiums, SMM Southeast Asian 6063 Aluminum Billet, and CIF Southeast Asia 6063 Aluminum Billet price points starting 3rd July 2026.
PriceJun 26, 2026 13:49SMM plans to officially launch the Thailand Zamak3 Premium.
PriceJun 18, 2026 17:39
Events
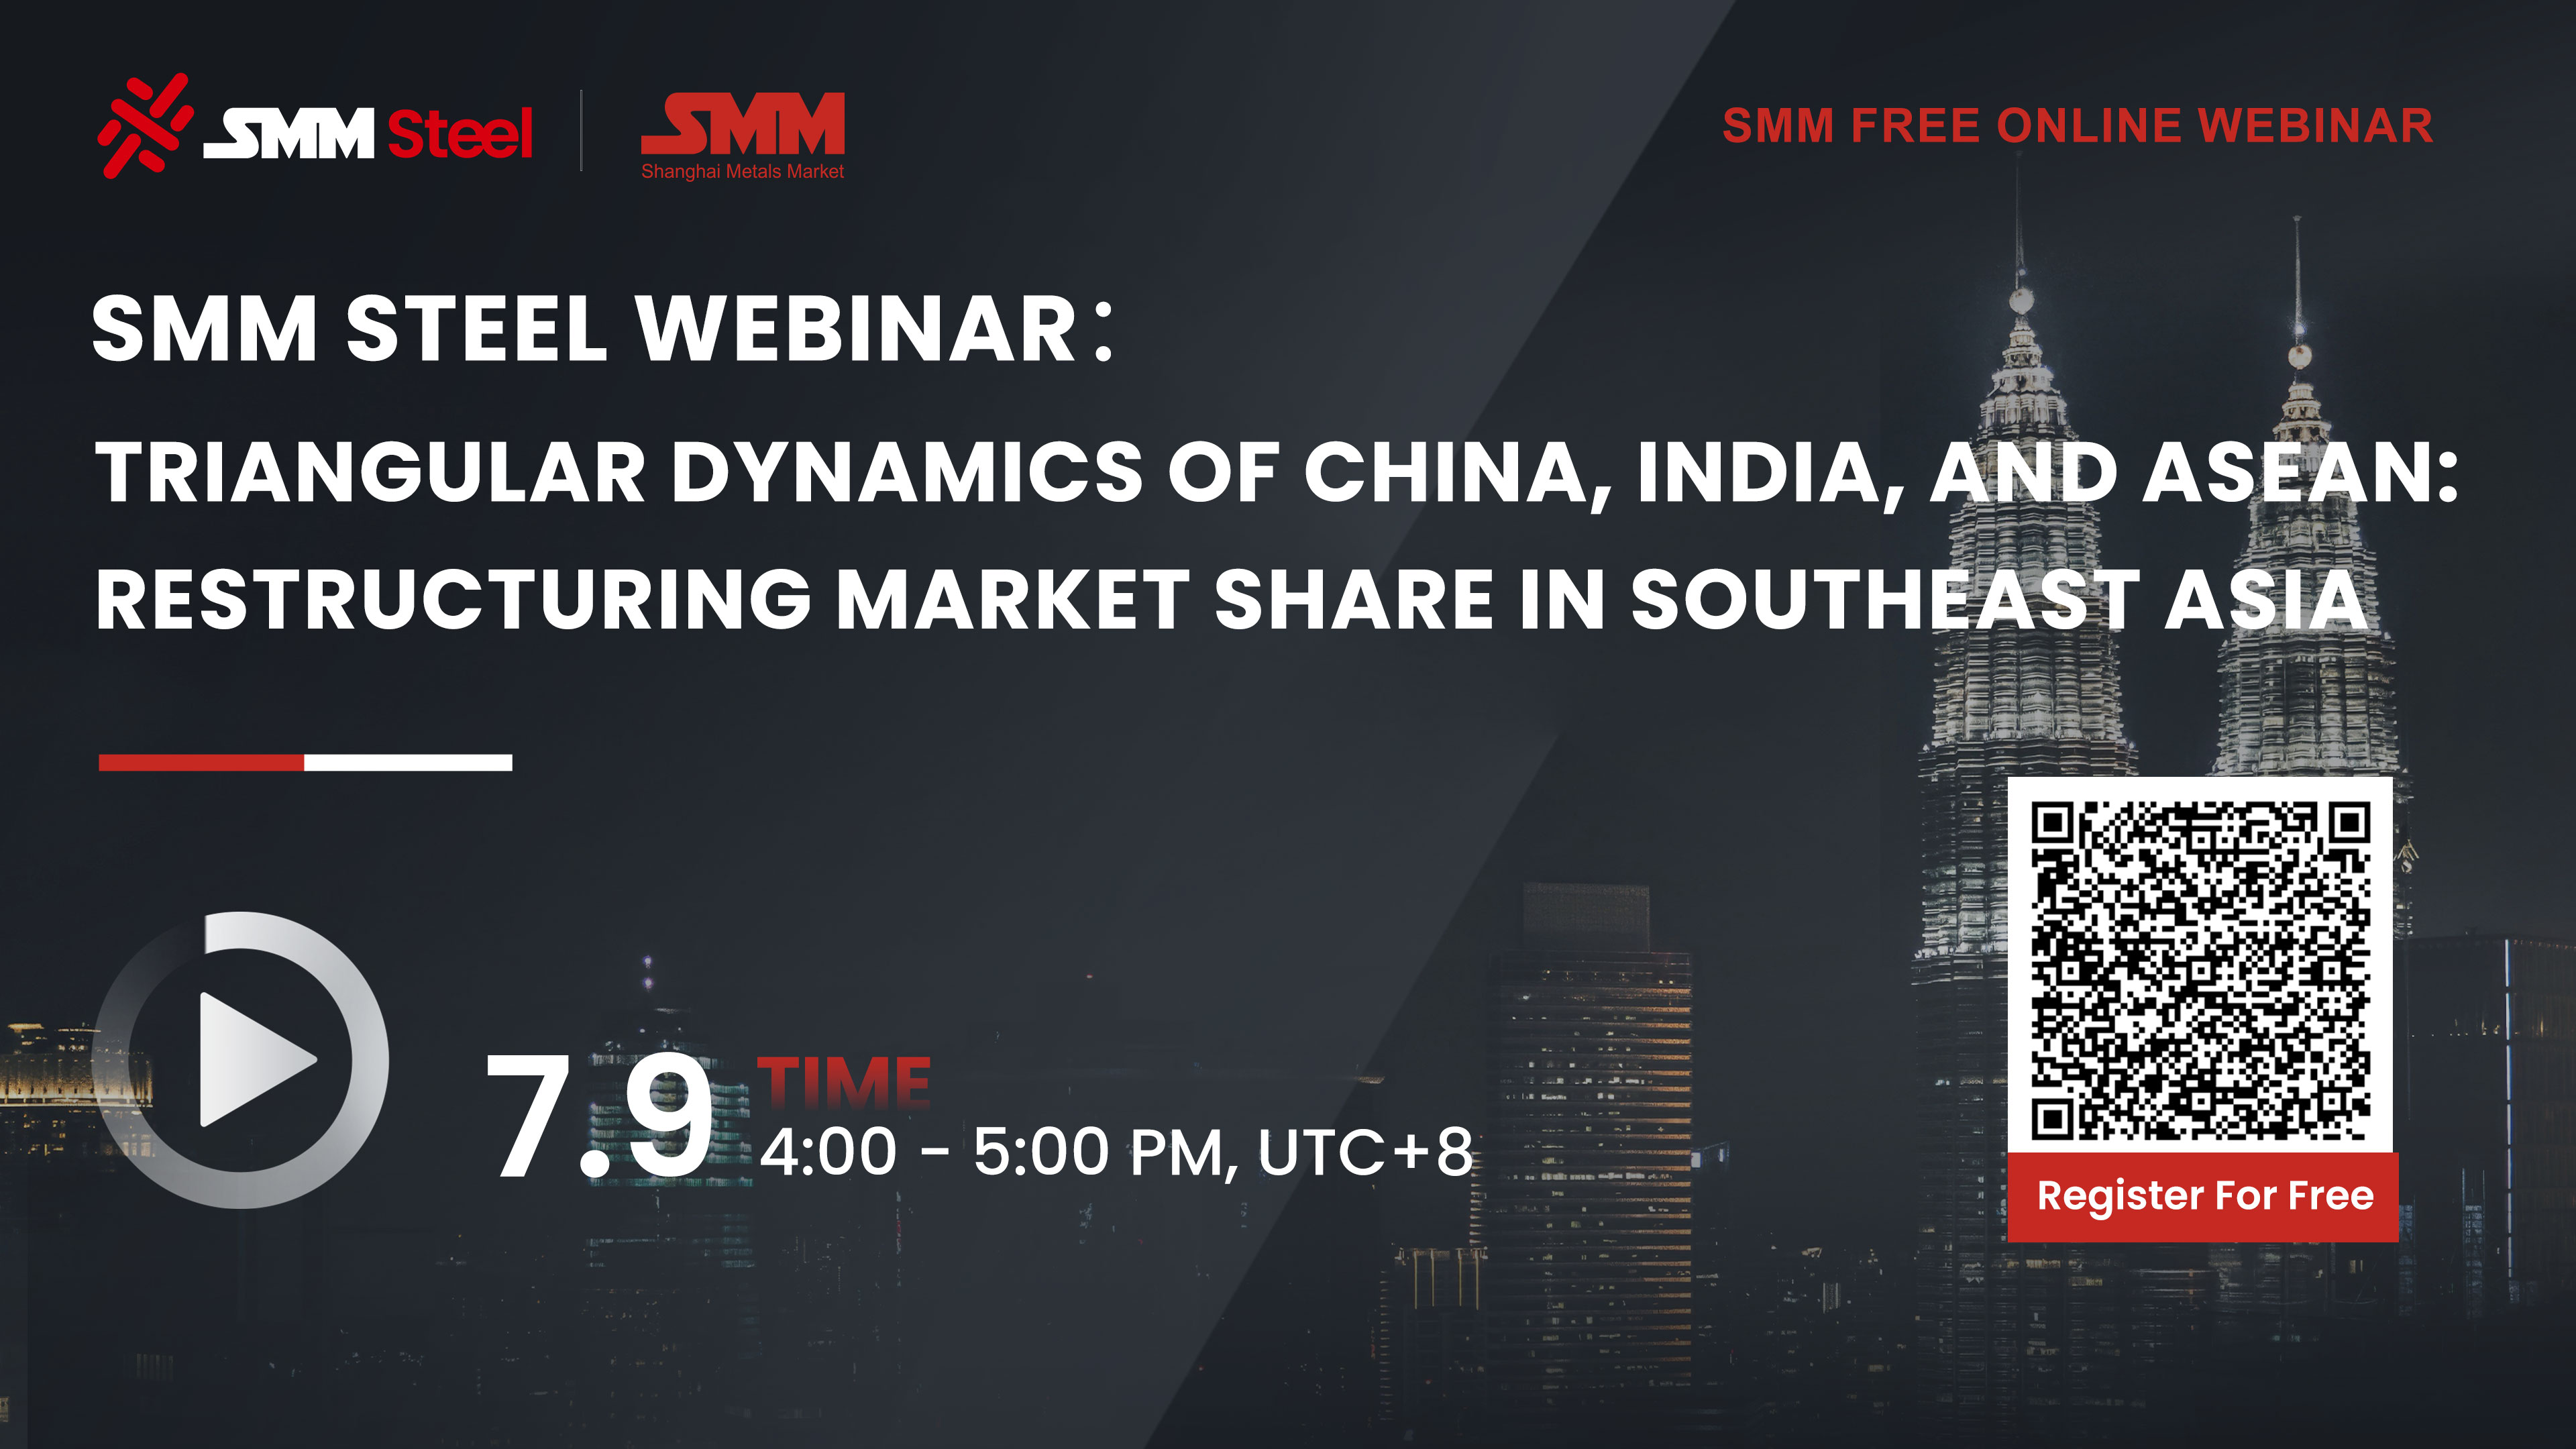 WebinarJul 9, 16:00 - Jul 7, 23:59 (GMT+8)
 Field TripJun 15 - 19, 2026 (GMT+8)Thailand & Indonesia
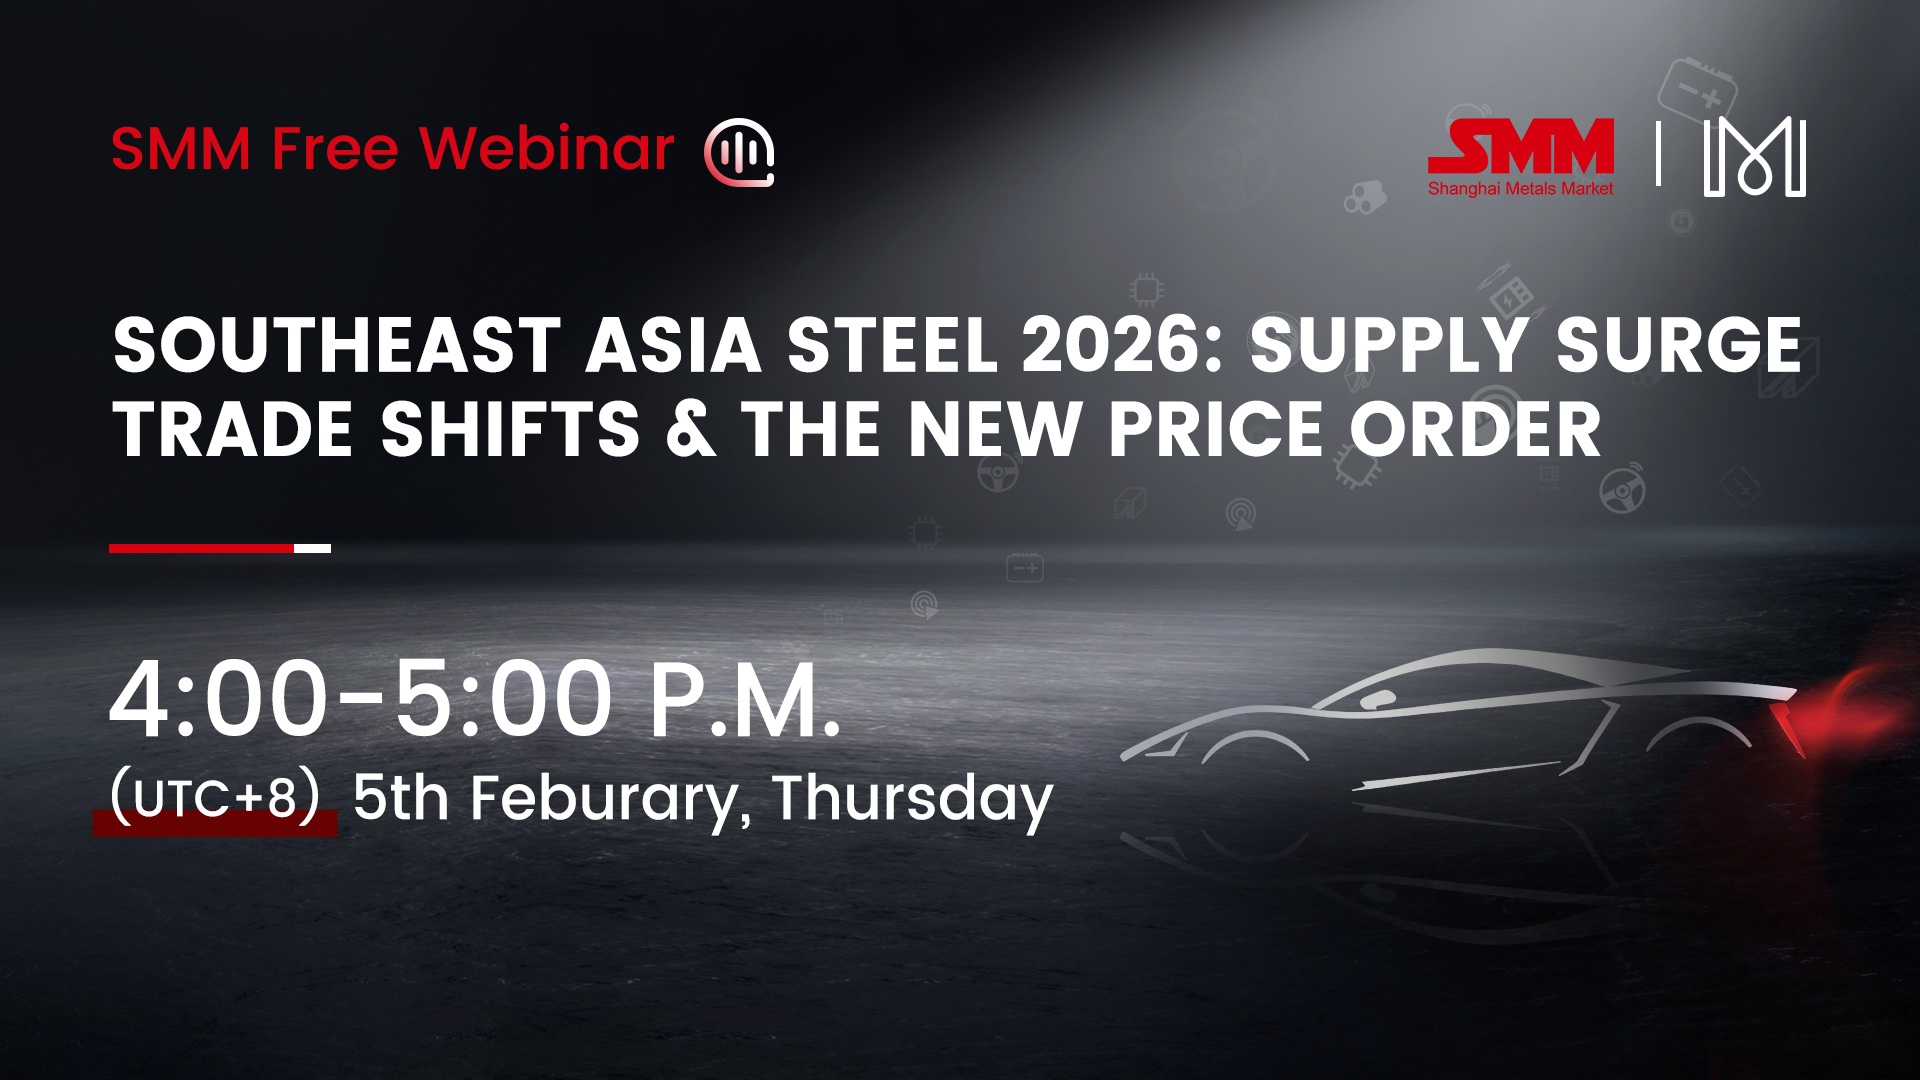 WebinarFeb 5, 16:00 - 23:59 (GMT+8)