

351results found for 'Nigeria'
Price
News
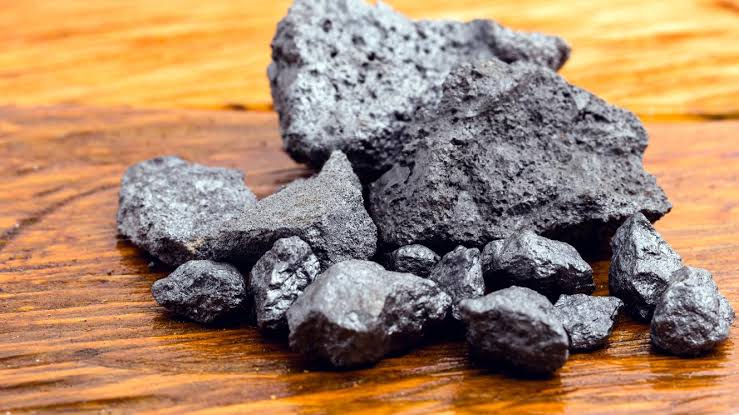 Nigerian Tantalum Concentrate Market: Pricing, Grades and Buyers
[SMM Research] Nigeria remains a key supplier of tantalum concentrate, with exports largely priced on an FOB basis and driven by strong Chinese demand. Concentrate grades vary widely, with higher Ta₂O₅ content commanding significant premiums. Artisanal mining dominates supply, while informal trade continues to limit market transparency. SMM's research indicates that first-hand market intelligence remains essential for assessing pricing, quality and evolving supply chains.
Jul 30, 2026 20:16- FOB Pricing Remains the Standard for Nigerian Tantalum Concentrate Exports
[SMM Express] Free on Board (FOB) remains the predominant pricing basis for Nigerian columbite-tantalite (coltan) concentrate exports, with most shipments priced at major export terminals including Onne Port in Rivers State and Apapa Port in Lagos. FOB pricing is widely used in transactions between Nigerian exporters and international buyers as it provides a transparent basis for valuing concentrates before freight and insurance costs are added. Market participants indicate that sales to Chinese trading companies and processors are frequently negotiated on a Cost, Insurance and Freight (CIF) basis for delivery to China, with the corresponding FOB value derived after deducting ocean freight and marine insurance costs. Meanwhile, smaller domestic and regional transactions may be concluded on Ex Works (EXW) or truck-delivered-to-port terms before cargoes enter formal export channels. The continued dominance of FOB pricing reflects established international trade practices for critical mineral concentrates and facilitates price benchmarking across global tantalum markets. As demand for transparent and traceable supply chains increases, standardised pricing mechanisms are expected to remain important in supporting efficient trade and market confidence.
Jul 29, 2026 20:36 - H1 Battery Materials Import & Export Data Released, Lithium Carbonate Imports Surge Over 50%, How About Other Segments? [SMM Special Topic]
Around July 20, 2026, June import and export data for cobalt and lithium battery industry chain related products were released in a concentrated manner. The data showed that China's spodumene imports reached 768,000 mt in physical content, up 13% MoM and surging 33% YoY, equivalent to approximately 72,000 mt of LCE. For lithium carbonate, China imported 25,861 mt in June, down 31% MoM but up 46% YoY. Cumulative lithium carbonate imports from January to June reached 179,000 mt, up 52% YoY... SMM compiled the H1 import and export situation of battery materials as follows: Upstream Lithium Concentrates In June 2026, China's spodumene imports reached 768,000 mt in physical content, up 13% MoM and surging 33% YoY, equivalent to approximately 72,000 mt of LCE. By source country: The effect of concentrated shipments from Australia at its fiscal year-end manifested, with port arrivals exceeding 370,000 mt in June, up 12% MoM. Mali: Port arrivals increased significantly MoM to 60,000 mt. South Africa and Nigeria maintained stable output, with port arrivals staying above 110,000 mt. Among them, the share of high-grade ore from Nigeria increased, with concentrates accounting for over 65%. Zimbabwe, affected by transportation efficiency earlier, saw arrivals of 42,000 mt in June, which pulled back MoM. Based on SMM's data screening, the total LCE equivalent of incoming ore in June was 72,000 mt. Notably, the proportion of lithium concentrates in total incoming ore fell to 72%, a MoM decline, mainly because most of the 65,000 mt from Brazil was previously traded lithium raw ore powder, which dragged down the overall concentrate share. In June 2026, China's total imports of lithium raw materials (spodumene + lithium sulfate) approached 80,000 mt of LCE, staying in a high range and providing a solid raw material base for the continuously climbing domestic lithium chemical production. Spodumene: Import Volume Continues to Rise, Australian Fiscal Year-End Push Contributes Significantly In June, China's spodumene imports reached 768,000 mt in physical content, up 13% MoM and surging 33% YoY, equivalent to approximately 72,000 mt of LCE. The import volume has maintained high growth for several consecutive months, reflecting that domestic lithium chemical plants' rigid demand for upstream ore remains strong. Source: China Customs, Compiled by SMM From a grade structure perspective, based on SMM's data screening, the proportion of lithium concentrates in total incoming ore in June fell to 72%, a MoM decline. The main drag was Brazil—its arrivals of 65,000 mt that month were mostly previously traded lithium raw ore powder; the concentrated arrivals of such low-grade minerals directly pulled down the overall proportion of concentrates. Besides spodumene, the import performance of another lithium raw material, lithium sulfate, is also worth noting. In June, China's lithium sulfate imports reached 13,500 mt, up 12% MoM, equivalent to over 7,700 mt of LCE. From the source perspective, Chile continued to dominate the supply landscape of this product with an absolute volume of 13,400 mt. Meanwhile, lithium sulfate imports from Zimbabwe also quietly rose to over one hundred mt. Although the absolute volume is still small, as the first batch shipment of lithium sulfate to China from the country, it marked the first step for subsequent regular supply growth from Zimbabwe. Summary: Raw material support was solid in June, but tightening expectations for the availability side are rising in July. In terms of total volume, combined imports of spodumene and lithium sulfate in June were equivalent to nearly 80,000 mt of LCE. Together with domestic lithium concentrate production of over 30,000 mt, total domestic lithium raw material supply reached over 110,000 mt of LCE in the month, providing ample and relatively solid raw material support for lithium chemical production fluctuating at highs in June. However, beneath the relatively optimistic aggregate data, one key variable deserves attention: Most of the June arrivals had their destinations locked in through orders weeks or even months earlier, with only a low proportion of cargo actually entering the freely tradeable circulation of traders. The continuation of this pre-locked structure means that entering July, the available volume for spot lithium ore in the spot market will remain tight. If downstream just-in-time procurement pace stays unchanged, the tightening of circulating supply will constrain lithium chemical plants' flexibility in securing raw materials to some extent, thereby limiting the further room for lithium carbonate production growth in July—a transmission effect already reflected in SMM's recent weekly lithium carbonate production data. Regarding spot prices for spodumene concentrates (CIF China), SMM data showed that the overall trend in June was a decline. As of June 30, the average spot price for spodumene concentrates (CIF China) was $2,260/mt, down $328/mt from $2,588/mt at the beginning of the month, representing a 12.67% decline. According to SMM, in June, enterprises extracting lithium from externally purchased spodumene saw their spot profits fall into deep losses. The losses continued to widen during the month, mainly because spodumene concentrate prices pulled back along with lithium carbonate but to a limited extent. In June, the decline in spodumene concentrate prices was less than that of lithium chemicals, leading to deepening losses in the processing segment. For externally purchased lepidolite, the immediate profit margin of enterprises extracting lithium from externally purchased lepidolite narrowed in June compared to May, but they still maintained positive immediate profits for the full month. The resumption of production at a leading mine in Jiangxi strengthened market expectations for longer-term supply release, and lithium carbonate futures plummeted 6.58% on the day. Additionally, the lithium carbonate market experienced an extreme trend of "sharp decline—weak rebound—further bottoming" in the fourth week of June, further squeezing the profit margins of enterprises relying on externally purchased ore. Lithium Carbonate According to customs data, China imported 25,861 mt of lithium carbonate in June, down 31% MoM but up 46% YoY. Of this, imports from Chile reached 16,037 mt, accounting for 62% of the total; imports from Argentina were 8,403 mt, representing 32% of the total; and imports from Indonesia stood at 500 mt, making up 2% of the total. China's cumulative imports of lithium carbonate from January to June totaled 179,000 mt, up 52% YoY. In May, China exported 261 mt of lithium carbonate, up 30% MoM but down 39% YoY. Cumulative exports from January to June reached 2,348 mt, down 5.6% YoY. According to SMM spot price data, the spot price of lithium carbonate generally declined in June. As of June 30, the spot price of battery-grade lithium carbonate fell to 156,500 yuan/mt, a drop of 22,500 yuan/mt from 179,000 yuan/mt at the beginning of June, representing a decline of 12.57%. SMM understands that the price center of spot lithium carbonate in China drifted lower in June. From a fundamental perspective, the supply side was disrupted by news of mine license renewals in Jiangxi, and China's lithium carbonate imports reached historic highs in May, while GFEX warrants remained elevated around 50,000 mt. The demand growth expectations were within market expectations, leading to a drift lower in prices. Upstream lithium chemical plants showed weak willingness to sell spot orders, maintaining an attitude of holding prices firm and holding back from selling; downstream material plants and battery cell manufacturers adopted a buy-the-dip strategy, engaging in substantial dip-buying for stockpiling when prices fell below 160,000 yuan/mt. As of July 23, the spot price of battery-grade lithium carbonate rose 3,500 yuan/mt from the previous trading day, reaching 142,000-151,000 yuan/mt, with an average price of 146,500 yuan/mt. Lithium Hydroxide According to customs data, in June 2026, China imported 4,400 mt of lithium hydroxide, up 12% MoM and surging nearly 2-fold YoY. By source country, imports from South Korea were 1,159 mt (26% of total), Chile ranked second with 993 mt, and notably, imports from Indonesia remained low at only 774 mt in June. In exports, China’s lithium hydroxide exports in June reached 6,018 mt, up 70% MoM, mainly driven by concentrated quarter-end shipments and a modest recovery in overseas demand. Of this total, exports to South Korea were 5,032 mt, and to Japan 679 mt. Overall, exports significantly exceeded imports during the month, and China's lithium hydroxide trade temporarily returned to a net export position after many months. Battery Materials LFP In June 2026, China’s LFP cathode export market experienced an "explosive" growth with both volume and price rising. June total exports reached 15,379.6 mt, surging 101.7% MoM from May, setting a new monthly record high. Along with the jump in export volume, the average monthly export price rose to $9,125.1/mt, an increase of about 11.1%. Price side, generally, raw material exports would see price declines due to scale effects, but in June, the average LFP export price ($9,125.1/mt), compared with May’s $8,210/mt, rose by $915/mt, mainly driven by cost pass-through: domestic lithium carbonate and iron phosphate prices both rose in June, directly pushing up export prices. June exports doubling MoM confirmed our assessment in last month’s flash report — “overseas demand remained robust, with several-fold YoY growth.” Overseas battery capacity is in a critical transition phase from “start-up” to “ramp-up,” creating a “rising volume and price” dividend period for the industry. For domestic material enterprises, locking in long-term contracts with core clients in North America, Europe, and Southeast Asia, and enhancing technological barriers, will be key to capturing high-premium overseas market share in H2. (Data sources: SMM and customs import/export statistics) [SMM Analysis] Volume and Price Both Surge! China’s LFP Exports Soared 101% MoM in June, Average Price Exceeded $9,100/Mt, Hitting a New High for the Year LiPF6 According to China Customs data, in June 2026, China’s cumulative LiPF6 exports were approximately 1,104.4 mt, down about 26.4% MoM, and cumulative LiPF6 imports were around 24.4 mt. In exports, China’s LiPF6 exports in June 2026 were about 1,104.4 mt, down about 26.4% MoM from May and down about 21.4% YoY. Specifically, major destinations included Poland (336.8 mt, down 25.47% MoM), South Korea (319.738 mt, down 45.9% MoM), Malaysia (113.211 mt, down 28.03% MoM), the US (157.601 mt, up 103.62% MoM), and Japan (115.56 mt, up 5.2% MoM). Overall, procurement volume of LiPF6 from outside China edged down in June. Artificial Graphite In June 2026, China's artificial graphite imports stood at 1,002 mt, up 2.3% MoM and up 3.3% YoY. As for import average price, in June 2026, the average import price of China's artificial graphite was 59,596 yuan/mt, down 0.9% MoM but up 16.6% YoY. Data sources: China Customs, SMM In June 2026, China's artificial graphite exports stood at 41,601 mt, down 16.9% MoM and down 18.7% YoY. As for export average price, in June 2026, the average export price of China's artificial graphite was 9,080 yuan/mt, up 17.5% MoM and up 13.9% YoY. Import side, volume and price fluctuations were relatively mild, and overall operations were stable. Export side, however, showed a 'volume down, price up' differentiation characteristic: the decline in export volume may be related to the high base in May and adjustments in overseas procurement pace at a certain stage; the rise in export average price was mainly driven by the continued pass-through of high domestic costs. Notably, although total exports declined, shipments of artificial graphite for lithium batteries from major exporting provinces showed a rebound, with one province's exports surging about 50% MoM and another province's MoM growth approaching 25%. Flake Graphite In June 2026, China's flake graphite imports stood at 4,147 mt, down 30% MoM and down 12% YoY. Data sources: China Customs, SMM In June 2026, China's flake graphite exports stood at 5,089 mt, down 33% MoM and down 5% YoY. In June, both imports and exports of flake graphite saw significant MoM declines, primarily due to the high base effect in May and seasonal demand adjustments in and outside China, with relatively mild YoY declines. Phosphoric Acid According to China Customs data, in Q2 2026, China's phosphoric acid exports exhibited a clear retreat after rapid rise, with exports shooting up to 40,200 mt in May before pulling back to 29,500 mt in June, down 26.5% MoM, but still achieved positive YoY growth compared to June last year (up 3,500 mt), as the continued expansion of rigid demand for new energy outside China offset the short-term pacing pullback. Based on the full-year policy pace and industry fundamentals, China's phosphoric acid trade is now displaying the distinct characteristics of zero imports, pure exports, strong policy-driven volatility, and continuous structural upgrade , with annual exports being influenced by both the agricultural input supply assurance policies and the seasonal cycles in and outside China, leading to an overall pattern of regular consolidating movements. ....... Based on the operating pace in H1 and considering the current policy cycle, overseas demand rhythm, and domestic spot fundamentals, in H2 2026 (July–August), the phosphoric acid industry remains in the window period for phosphate fertiliser export controls, with agricultural crude phosphoric acid exports restricted and the overall export volume subject to a natural ceiling. Supported by the release of off-season restocking demand from overseas food and energy storage enterprises, phosphoric acid exports are expected to recover slightly from the June low, returning to above the monthly average of 30,000 mt, slightly offsetting the pressure of inventory buildup during the domestic agricultural off-season and using the resilience of external demand to firm up the market bottom. Entering September–December, the industry fundamentals and foreign trade landscape will see significant improvement. On August 31, the phosphate fertiliser export control policy officially expires. Coupled with concentrated restocking by overseas agricultural input companies in Q4, year-end capacity sprint by domestic LFP enterprises, and concentrated delivery of overseas lithium battery long-term contract orders, phosphoric acid exports will enter the peak period of the year, with monthly export volume expected to exceed 40,000 mt and hit a new high for the year. The industry’s overall export volume and trade surplus will rise simultaneously. The dual boost from domestic and external demand will drive the industry’s market conditions into an upward inflection point, with not only wet process phosphoric acid demand continuing to recover, but thermal process phosphoric acid also benefiting from concentrated stockpiling in food and electronic fine chemicals, strengthening simultaneously, ushering in a peak season where both wet and thermal processes thrive. Phosphate Ore In H1 2026 (January–June), China’s phosphate ore imports stood at 998,200 mt, up 29.66% YoY; exports at 133,900 mt, up 225.91% YoY; net imports at 864,300 mt. Four Key Changes 1. Imports Recovered to the 2024 High Level . H1 2026 imports of 998,200 mt grew 29.66% from 769,800 mt in H1 2025, recovering to the level of 986,600 mt in H1 2024. In 2026, the single-month high was 243,900 mt in January, followed by secondary peaks of 206,600 mt in April and 182,100 mt in March. The import side rebounded significantly from the trough of 769,800 mt in H1 2025, confirming that the "high import" center has been established since 2024. 2. Exports Tripled, Hitting a Nearly 4-Year High . H1 2026 exports of 133,900 mt surged 225.91% from 41,100 mt in H1 2025, the highest level since H1 2023 (191,300 mt). In June alone, imports reached 50,900 mt, followed by 32,200 mt in May and 11,100 mt in April, forming a volume expansion structure in Q2, which closely aligns with the event window of Egypt's announcement on May 13 to halt new phosphate ore export contracts (shifting to higher value-added phosphate fertiliser exports). 3. Net imports remain high but narrowed . In 2026 H1, net imports stood at 864,300 mt, significantly higher than 942,800 mt in 2024 H1 (historical peak) and 728,700 mt in 2025 H1, reflecting the persistent supply gap of phosphate ore in China and continued high external dependence. 4. The seasonal pattern between H1 and H2 was disrupted. Historically, H1 imports were typically lower than H2 (cumulative H2 imports from 2020 to 2025 reached 2.7531 million mt, significantly higher than H1), but 2026 H1 imports of 998,200 mt already approached 2025 H2's 949,900 mt—the traditional winter stockpiling season in Q3-Q4 was delayed, and the import pace became more evenly distributed throughout the year. ......... Outlook for H2: Imports: H1 imports already reached 998,200 mt , and with winter stockpiling procurement + LFP cathode material stockpiling (preparing for the NEV peak season in Q3-Q4), 2026 H2 imports are expected to reach 1.1-1.3 million mt, with full-year imports at 2.1-2.3 million mt, up 15%-25% YoY, marking a historical high since 2023. Exports : June's 50,900 mt already showed signs of acceleration, with July-September exports projected at 100,000-200,000 mt. In Q4, driven by overseas demand (India, Southeast Asia, Brazil) + export competition restructuring among Egypt/Jordan/Morocco, full-year exports are expected at 200,000-300,000 mt, up 200%-300% YoY. Net imports: 2026 net imports are projected at 1.7-2 million mt, remaining at historically high levels, reflecting the persistent undersupply of phosphate ore in China and continued rising dependence on overseas sources (Egypt/Jordan/Morocco/Kazakhstan/Peru/Algeria). Sulphur & Sulphuric Acid China's Monthly Sulphur Imports (2025 H1 vs. 2026 H1) In 2026 H1, China's sulphur imports showed a "monthly accelerating contraction" trend. Cumulative imports from January to June were approximately 2.26 million mt , a sharp decline of 57.7% compared to 5.34 million mt in the same period of 2025, with average monthly imports plummeting from around 800,000 mt in 2025 to about 380,000 mt. On a monthly basis, imports in January–March stayed around 500,000 mt (496,000/538,000/516,000 mt); from April, they plunged off a cliff , with April plunging to 296,000 mt and May to 268,000 mt, and June hitting 147,000 mt (down 85.1% YoY) — June monthly imports fell to less than 20% of the same period in 2025 (988,000 mt). Historically, total imports in 2025 were about 9.61 million mt , with a monthly average of about 800,000 mt and stable volume, while the 147,000 mt in June 2026 marked a rarely seen low in recent years . If geopolitical conflicts and Kazakhstan's export ban persist, H2 imports may face further pressure, with the full-year total expected to be only about 40% of the 2025 level . ....... Sulphur Imports: Volume Plunge and Source Restructuring — In H1 2026, imports were about 2.26 million mt, down 57.7% YoY (June down 85% YoY); the share of four Middle Eastern countries was cut in half (from ~35% to ~20%), with South Korea, Oman, and Canada filling the gap (combined ~58%). Sulphuric Acid Exports: Ban Leads to Zero Clearance — In H1 2026, exports were about 780,000 mt, down 64% YoY; June exports were only about 980 mt, down 99.7% YoY , plunging out of the global market; Indonesia emerged as the top destination. Common Logic: The dual effects of geopolitical conflict and export controls have pushed China from a global sulphur resource hub towards self-preserving contraction. In terms of cobalt, Cobalt Hydrometallurgy Intermediate Products In June 2026, China's imports of cobalt hydrometallurgy intermediate products totaled about 10,961 mt in physical content, up 324% MoM and down 42% YoY, of which imports from the DRC were about 10,815 mt in physical content, up 423% MoM and down 43% YoY. The average import price of cobalt hydrometallurgy intermediate products in June 2026 was $16,352/mt, down 1.54% MoM. Out of the monthly imported intermediate products, about 7,561 mt in physical content entered Zhejiang and Guangdong provinces via Entrepot Trade by Customs Special Control Area, accounting for 69% of total imports; ordinary trade accounted for about 2,849 mt in physical content, or 26%; and processing trade with imported materials accounted for about 550 mt in physical content, or 5%. Unwrought Cobalt In June 2026, China's imports of unwrought cobalt were about 1,120 mt, up 66% MoM and up 105% YoY. In June, by country, the top three sources of refined cobalt imports were Indonesia, Russia, and Madagascar, with imports of 476 mt, 293 mt, and 148 mt, respectively. Although China's refined cobalt price pulled back significantly in June, the import and export windows remained fully closed. However, due to weak ex-China refined cobalt demand, some overseas traders still chose to ship refined cobalt to China, leading to a significant increase in imports. China's average unwrought cobalt import price in June 2026 was $52,228/mt, down 4.27% MoM. Cumulative imports in January-June 2026 were 7,709 mt, up 118% YoY. On the export side, China's unwrought cobalt exports in June 2026 were approximately 503 mt, up 36% MoM and down 46% YoY. By country, the top three export destinations were the US, Taiwan, China, and the Netherlands, with exports of 132 mt, 125 mt, and 66 mt, respectively. The average export price of unwrought cobalt from China in June 2026 was $59,579/mt, up 11.56% MoM. Cumulative exports in January-June 2026 were 2,664 mt, down 76% YoY.
Jul 29, 2026 11:34 - China Remains the Primary Export Market for Nigerian Tantalum Concentrates
[SMM Express] China continues to dominate the export market for Nigerian tantalum concentrates, accounting for an estimated 80%–90% of formal export volumes. Most shipments are purchased by Chinese trading companies and processors, with downstream refining concentrated in major processing hubs such as Jiangxi, Fujian and Guangdong. Europe remains an important secondary destination, with tantalum concentrates supplied to processors and commodity traders serving markets in Germany, Estonia, Belgium and the Netherlands. Smaller volumes are also routed through trading hubs in Malaysia and Singapore before entering downstream supply chains, while interest from the United States is increasing as efforts to diversify critical mineral supply chains continue. A notable share of Nigerian columbite-tantalite production is also understood to move through informal cross-border trade routes before entering formal international markets. These unofficial flows make it more challenging to accurately monitor export volumes, pricing and end-market destinations, highlighting the importance of improved supply chain transparency in the global tantalum market.
Jul 28, 2026 22:41 - Nigerian Coltan Market Dominated by Small-Scale Mining, Higher-Grade Concentrates Fetching Premium Prices
[SMM Express] Nigeria's recent columbite-tantalite (coltan) market has been primarily supplied by artisanal and small-scale mining operations, with 20–30% Ta₂O₅ concentrates accounting for the largest share of production and trade. Higher-grade concentrates containing 30–40% Ta₂O₅ are produced through basic beneficiation and generally command premium prices, while 40%+ Ta₂O₅ material remains relatively limited but is highly valued by downstream processors. Market observations indicate that buyers, particularly tantalum processors, generally prefer concentrates containing 30% Ta₂O₅ or higher, as these reduce processing costs and improve refining efficiency. Material grading below 25% Ta₂O₅ typically trades at a discount owing to the additional upgrading required before refining. Nigerian coltan is commonly produced as a mixed columbite-tantalite concentrate, containing both tantalum pentoxide (Ta₂O₅) and niobium pentoxide (Nb₂O₅). The relative proportions vary by mining area, with some deposits yielding niobium-rich concentrates while others contain higher tantalum content.
Jul 28, 2026 22:20 - [SMM PV Brief] Nigeria's 9MW PV Project Completed and Commissioned
Recently, a 9 MW PV rooftop project in an industrial and commercial park in Lagos, Nigeria, Africa, was successfully completed and put into operation. The entire power station is fully equipped with Ulica Gaoshan Fuguang double-glass PV modules, continuously delivering clean electricity and injecting stable green momentum into the park’s production and operations. West Africa is hot year-round, with large temperature differences between day and night, and some areas also experience sandstorms and high humidity, posing stringent challenges to the weather resistance of PV modules. The Ulica double-glass modules selected for this project have undergone a full suite of rigorous TÜV reliability tests, demonstrating excellent high-temperature resistance, anti-degradation, and mechanical load performance, enabling them to adapt to the complex outdoor conditions in West Africa and ensure long-term, stable power generation. From laboratory detection to field validation in large-scale commercial and industrial projects, the product’s reliable performance in high-temperature regions has been consistently confirmed.
Jul 27, 2026 13:54
Announcements
Dear Users, Since the beginning of this year, imported titanium concentrate has impacted the domestic market, and its price fluctuations have garnered close attention from downstream enterprises such as titanium dioxide and sponge titanium producers. To promote international trade of titanium products, assist global upstream and downstream enterprises in grasping market dynamics, obtaining spot price information, reducing cross-border transaction risks and costs, and deepening industry chain research, SMM has decided to launch five new price points for titanium concentrate and rutile for market reference, effective from December 29th . The specific price point information is as follows: Price Point: Titanium Concentrate (Mozambique TiO₂ ≥46%) Price Definition: VAT included, spot transaction price at port Unit of Account: RMB/tonne Country of Origin: Mozambique Price Generation Regions: Major Chinese ports including Caofeidian Port, Qinzhou Port, Zhanjiang Port, Rizhao Port, etc. Product Standard: Conforms to YB/T 4031-2015 standard, with specifications: TiO₂ (dry basis): ≥ 46.00%, S: ≤ 0.25%, P: ≤ 0.06%, Fe₂O₃: ≤ 8.0%, H₂O: ≤ 1.0% Minimum Quantity Requirement: ≥30 tonnes Release Time: Before 11:30 AM Beijing Time on business days Price Point: Titanium Concentrate (Nigeria TiO₂ ≥50%) Price Definition: VAT included, spot transaction price at port Unit of Account: RMB/tonne Country of Origin: Nigeria Price Generation Regions: Major Chinese ports including Qinzhou Port, Rizhao Port, etc. Product Standard: Conforms to YB/T 4031-2015 standard, with specifications: TiO₂ (dry basis): ≥ 50.00%, S: ≤ 0.20%, P: ≤ 0.040%, Fe₂O₃: ≤ 7.0%, H₂O: ≤ 1.0% Minimum Quantity Requirement: ≥30 tonnes Release Time: Before 11:30 AM Beijing Time on business days Price Point: Titanium Concentrate (Australia TiO₂ ≥50%) Price Definition: VAT included, spot transaction price at port Unit of Account: RMB/tonne Country of Origin: Australia Price Generation Regions: Major Chinese ports including Caofeidian Port, etc. Product Standard: Conforms to YB/T 4031-2015 standard, with specifications: TiO₂ (dry basis): ≥ 50.00%, S: ≤ 0.20%, P: ≤ 0.040%, Fe₂O₃: ≤ 7.0%, H₂O: ≤ 1.0% Minimum Quantity Requirement: ≥30 tonnes Release Time: Before 11:30 AM Beijing Time on business days Price Point: Rutile (Sierra Leone TiO₂ ≥95%) Price Definition: VAT included, spot transaction price at port Unit of Account: RMB/tonne Country of Origin: Sierra Leone Price Generation Regions: Major Chinese ports including Qinzhou Port, etc. Product Standard: Conforms to common industry standards for rutile concentrate, with specifications: TiO₂ (dry basis): ≥ 95.00%, S: ≤ 0.02%, P: ≤ 0.020%, Fe₂O₃: ≤ 0.50%, H₂O: ≤ 0.50% Minimum Quantity Requirement: ≥30 tonnes Release Time: Before 11:30 AM Beijing Time on business days Price Point: Rutile (Sierra Leone TiO₂ ≥90%) Price Definition: VAT included, spot transaction price at port Unit of Account: RMB/tonne Country of Origin: Sierra Leone Price Generation Regions: Major Chinese ports including Qinzhou Port, etc. Product Standard: Conforms to common industry standards for rutile concentrate, with specifications: TiO₂ (dry basis): ≥ 90.00%, S: ≤ 0.05%, P: ≤ 0.040%, Fe₂O₃: ≤ 1.20%, H₂O: ≤ 0.80% Minimum Quantity Requirement: ≥30 tonnes Release Time: Before 11:30 AM Beijing Time on business days SMM Titanium Industry Research Team December 23, 2025
PriceDec 23, 2025 13:23