283results found for 'Grasberg Mine'
Price
News
- ICSG: Global Copper Mine Production Flat in Q1, LME Copper and SHFE Copper Both Closed Higher Overnight [SMM Copper Morning Meeting Minutes]
SMM Morning Meeting Minutes: Last Friday evening, LME copper opened at $13,624.5/mt. In the early session, it experienced wild swings and dipped to $13,575.5/mt. Subsequently, the center of copper prices shifted upward, reaching a high of $13,678/mt, before fluctuating downward to finally close at $13,635/mt, up 0.18%. Trading volume reached 16,200 lots, and open interest stood at 269,000 lots, a decrease of 3,435 lots from the previous trading day, indicating bears reducing positions. Last Friday evening, the most-traded SHFE copper 2607 contract opened at 104,870 yuan/mt. In the early session, the center of copper prices fluctuated downward, touching a low of 104,420 yuan/mt. Subsequently, it fluctuated upward, reaching 105,280 yuan/mt, before moving sideways to finally close at 105,090 yuan/mt, up 0.58%. Trading volume reached 33,600 lots, and open interest stood at 172,000 lots, an increase of 627 lots from the previous trading day, indicating bulls adding positions.
May 25, 2026 09:24 - Global Copper Mine Production Flat in Q1 2026, Indonesia's Grasberg Mine Sees Sharp Decline
Preliminary data indicated that global copper mine production in Q1 2026 was basically flat, with copper concentrates production declining by 1.1%, offset by a 3.3% increase in solvent extraction-electrodeposition (SX-EW) production.Although global mine production benefited from additional output from capacity ramp-up at projects in several countries, significant declines in copper concentrates production in Chile, the DRC, and Indonesia offset global growth.In Indonesia, copper concentrates production at the Grasberg mine fell by 42%, as the severe mud inflow event that occurred in September last year continued to impact production at the mine.
May 24, 2026 00:15 - ICSG: Global Copper Cathode Market Recorded 396,000 mt Oversupply in Q1 2026
The International Copper Study Group (ICSG) released preliminary data on global copper supply and demand for March 2026 in its monthly bulletin published in May 2026. Preliminary data indicated that global copper mine production in Q1 2026 was basically flat, with copper concentrates production declining by 1.1%, offset by a 3.3% increase in solvent extraction-electrodeposition (SX-EW) production. Although global mine production benefited from additional output driven by capacity ramp-up of projects in several countries, significant declines in copper concentrates production in Chile, the DRC, and Indonesia offset global growth. In Indonesia, copper concentrates production at the Grasberg mine fell by 42%, as the severe mud inflow incident that occurred in September last year continued to affect the mine's production. Chile's mine production declined by 5.8%, with increased production at the Collahuasi and Quebrada Blanca mines offset by production cuts at the Spence, El Teniente, Escondida, and Los Pelambres mines. The DRC's mine production is estimated to have grown by only 0.5%: SX-EW production increased by approximately 10%, but was partially offset by a 36% decline in copper concentrates production due to reduced output at the Kamoa mine (affected by the 2025 earthquake event). In Peru, copper mine production grew by 3.3%, primarily driven by increased production at the Antamina, Las Bambas, and Antapaccay mines, which more than offset production declines at Southern Peru Copper, Quellaveco, and Marcobre. Mongolia's copper concentrates production is estimated to have grown by approximately 36%, benefiting from the capacity ramp-up of the Oyu Tolgoi underground project. Preliminary data indicated that global copper cathode production grew by approximately 4.5% in Q1 2026, with primary copper (electrolysis and ore electrodeposition) production increasing by 3.8% and secondary copper (from scrap) production increasing by 7.6%. China and the DRC, which currently account for approximately 60% of global production, saw their combined production increase by an estimated 9% (China 8.8%, DRC 10%). Excluding these two countries, global copper cathode production declined by approximately 1.4%. Chile's copper cathode production fell by 11.7%, with copper cathode (from concentrates) production declining by 24% due to smelter operational constraints and maintenance, and electrodeposition copper production declining by 5.7%. Production in Asia (excluding China) is estimated to have declined by 4%, mainly due to production decreases in Japan, Indonesia, and the Philippines. India's production is estimated to have grown by 25%, benefiting from improved capacity utilization rates and the capacity ramp-up of the Adani smelter. Global secondary refined copper production (from scrap) increased by 7.6%, mainly driven by growth in China. Preliminary data indicated that global apparent refined copper usage grew by 0.8% in Q1 2026. Although global usage excluding China was estimated to have grown by 1.7%, China's apparent demand (excluding bonded warehouse/unreported inventory changes) was estimated to be basically flat, affected by a 40% decline in China's net imports of copper cathode. China currently accounts for approximately 58% of total global refined copper usage. The preliminary global refined copper supply-demand balance indicated an oversupply of 396,000 mt in Q1 2026. In compiling the global market balance, ICSG used China's apparent demand calculation method, which does not account for changes in unreported inventories. However, to facilitate global market analysis, an adjustment item has been added to the attached tables — "Global refined copper balance adjusted for Chinese bonded warehouse inventory changes" — which adjusts the global refined copper balance based on the average bonded warehouse inventory change estimates from two Chinese copper market consultancies. In Q1 2026, the global refined copper balance based on China's apparent usage (excluding bonded warehouse/unreported inventory changes) showed a preliminary oversupply of approximately 396,000 mt, compared with an oversupply of approximately 135,000 mt in the same period of 2025. The global refined copper balance adjusted for estimated changes in Chinese bonded warehouse inventories showed a market oversupply of approximately 386,000 mt. Copper Prices and Inventories: Based on the average estimates from two independent consultancies, Chinese bonded warehouse inventories were estimated to have decreased by approximately 10,000 mt from the end of 2025 levels during the first three months of 2026. As of the end of April 2026, copper inventories at major metal exchanges (LME, COMEX, SHFE) totaled 1,148,760 mt, the highest level since January 2003. Inventories increased by 404,648 mt, or 55%, from the end of December 2025, with LME up 253,350 mt, Shanghai Futures Exchange up 46,683 mt, and COMEX up 104,615 mt. The LME spot copper average price in April was $12,891.38 per mt, up 3% from the March average price of $12,498.98 per mt. The 2026 copper price high and low were $14,097 per mt (May 13) and $11,826 per mt (March 19), respectively, with a year-to-date average price of $12,947.22 per mt, up 30% from the 2025 average price. Global Refined Copper Supply and Demand Trends Notes: 1/ Refers to apparent usage 2/ Refined copper balance = production - usage 3/ Seasonally adjusted balance data 4/ Global refined copper balance adjusted for estimated changes in Chinese bonded warehouse inventories (Wenhua Composite)
May 23, 2026 10:41 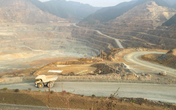 Copper Concentrate TCs Break Through Negative Triple Digits: What Challenges Do Smelters Face?
I. Market Status: Negative TCs Enter Triple Digits, Structural Tightening in Copper Concentrate Supply-Demand As global smelter capacity continues to climb, China, as the world's largest copper smelting country, faces a continuously declining self-sufficiency rate in copper concentrates and rising external dependency. Compounded by geopolitical crises, production cuts by ex-China miners, declining mine grades, and frequent production accidents, the copper industry has undergone a dramatic shift from "tight balance" to "structural deficit." Currently, the global copper concentrate market has fallen into a state of persistently tight supply. On May 15, the SMM Imported Copper Concentrate Index (weekly) reported -$102.84/dmt, breaking through the -$100/dmt threshold for the first time in history, setting a record negative depth. The payable indicator for 20%-grade domestic trade ore was 97.5%-98.5%, up 0.5 percentage points MoM. Supply-side factors driving TCs persistently lower continue to accumulate. 1) Full production resumptions at Freeport's Grasberg mine have fallen short of expectations. According to Freeport's Q1 earnings call, the company plans to achieve full production resumptions by the end of 2027; 2) The Peruvian government signed Emergency Decree No. 003-2026 on May 11, triggering widespread market concerns over the country's energy supply and copper mine output; 3) Geopolitical disruptions—the continued blockade of the Strait of Hormuz has driven sulfur prices persistently higher, pushing smelting acid prices to rise continuously. With smelting profits climbing, smelters' purchase willingness has increased, driving copper concentrate TCs persistently lower. Customs data showed that China's copper ore and concentrate imports in April 2026 were 2.352 million mt in physical content, down 19.57% YoY; cumulative imports from January to April were 9.915 million mt in physical content, down 0.8% compared to the same period last year. Since December 2020, China's copper concentrate cumulative imports had maintained positive YoY growth; this marks the first decline in over five years. II. Smelter Operating Rates Stay High Contrary to the intuition of "industry-wide losses" implied by deeply negative TCs, operating rates at China's copper smelters have not experienced a cliff-like decline. From a pure smelting perspective, operating willingness and actual profitability across different types of enterprises show significant divergence. Under the extreme environment of deeply negative TCs, the core reason China's copper smelters can maintain relatively resilient operations is that by-product revenues are becoming the key variable determining break-even. Meanwhile, China's copper cathode production declined MoM due to the maintenance peak. SMM data showed that China's copper cathode production in April fell 2.26% MoM. Cumulative copper cathode production from January to April 2026 reached 4.7067 million mt. However, according to SMM, some smelters postponed their maintenance plans or completed crude smelting maintenance ahead of schedule to capture revenue from the by-product sulphuric acid. III. Breakdown of Smelter Profit Sources (i) Sulphuric Acid: The Strongest Profit Contributor at the Current Stage Sulphuric acid is currently the most important by-product profit source for smelters. In pyrometallurgy-based copper cathode production, approximately 3-4 mt of sulphuric acid is produced as a by-product for every 1 mt of copper cathode. As of May 15, the SMM China Copper Smelting Acid Index stood at 1,665 yuan/mt, up 83.7% from the beginning of the year. Sulphuric acid prices currently stay high, meaning sulphuric acid revenue can offset a considerable portion of the revenue loss caused by negative TCs. However, this "sulphuric acid moat" is facing policy challenges. China suspended exports of ordinary industrial sulphuric acid and smelting by-product sulphuric acid starting in May for a period of 8 months. The export ban is not intended to suppress domestic sulphuric acid prices, but rather to prioritize domestic supply for agricultural phosphate fertiliser production and strategic industries such as new energy. Demand side, overall sulphuric acid demand remains tight. Although downstream sectors including phosphate fertiliser, titanium dioxide, and new energy materials saw declining operating rates due to high-priced raw materials, just-in-time procurement still exists. Meanwhile, the supply side is also constrained by concentrated smelter maintenance and high sulphur-based acid production costs, with industry-wide capacity utilization rates at low levels. Cost side, firm sulphur prices provide bottom support for sulphuric acid; supply side, concentrated maintenance limits downside room; demand side, although weak, has not yet formed a substantial enough impact to break down high prices. This means sulphuric acid continues to serve as a profit pillar for smelters. (ii) Precious Metal Recovery: "Incremental Game" Under High Copper Prices In addition, copper concentrates typically contain associated precious metals such as gold and silver, which can be recovered through anode slime processing during smelting. Copper prices are currently at historically high levels, and gold prices also fluctuate at highs, greatly enhancing the economics of precious metal recovery. According to SMM market sources, when gold and silver prices are at high levels, raw materials with impurities rich in gold and silver are assigned extremely high added value. The profit contribution of precious metal recovery to smelters is reflected in: smelters can achieve recovery utilization rates exceeding the gold and silver payable indicators through refined processing, profiting from spot smelting revenue. This portion of revenue is often a significant component of smelters' comprehensive profit structure. However, as gold and silver prices continue to rise, suppliers in the copper concentrates spot trade are simultaneously raising gold and silver payable indicators. The continuously rising precious metal payable indicators and payable benchmark pose an increasingly severe challenge to smelter profitability. IV. Future Trends: Coexistence of Industry Landscape Evolution and Technology Upgrade Requirements However, industry chain profits are irreversibly shifting toward the upstream ore side. Under the medium and long-term landscape of persistently tightening copper concentrates supply and demand, the scarcity value of the resource side is being reassessed by the market. As the copper concentrates supply-demand gap persists over the medium and long-term horizon, and smelters' bargaining power will remain under pressure over the long term. The market is widely concerned about whether TC can quickly pull back in tandem once the continuously rising sulphuric acid prices reach a turning point. Facing the long-term trend of profit squeeze at the mine end and losses in the smelting segment, the future landscape of the copper smelting industry will evolve in the following directions: Direction 1: Integrated consolidation extending upstream. Enterprises with upstream mine assets will have a significant advantage in profitability. Direction 2: Technological upgrades to achieve differentiated competition. Against the backdrop of narrowing profit margins from non-payable metals, the technological barriers of smelters will become increasingly important. Those who can more efficiently extract valuable metals from low-grade ore or complex ore will seize the initiative in the industry reshuffle. Under the extreme environment of persistently negative TCs, sulphuric acid by-product revenue and precious metal recovery are the core profit pillars currently sustaining smelter operations. The supply-demand pattern dictates that the pricing power and profit margins at the mine end will continue to outperform those at the smelting end. The copper smelting industry is transitioning from the traditional model of "earning TCs" to a new competitive landscape of "resource control + technological barriers + integrated operations."
May 19, 2026 15:48- Supply Concerns Continue to Escalate, Copper Prices Surge Unstoppably [Wenhua Observation]
Driven by recovering risk appetite and China's peak demand season, copper prices both in China and abroad bottomed out since late March. However, as SHFE copper returned to the 100,000 level, the tug-of-war between longs and shorts increased, and futures prices shifted to range-bound consolidation. After the Labour Day holiday, copper prices quickly resumed their upward momentum. Today, prices opened higher with a gap and continued to rise, with SHFE copper just one step away from the record high set at the end of January, while LME copper hit a new closing high. What is fueling such strong confidence behind this rally? Deepening Ore-Side Vulnerability Intensifies Supply Disruption Concerns Since the suspension of First Quantum's Cobre Panama copper mine at the end of 2023, spot TC for copper concentrates in China has been caught in an endless downward spiral. Falling from around $80/dmt at the end of 2023, it largely dropped to single-digit levels and moved sideways in 2024. Entering 2025, it further plunged into negative territory, mainly due to successive production disruptions at world-class copper mines including Ivanhoe Mines' Kakula, Codelco's El Teniente, and Freeport's Grasberg mine in Indonesia. Entering 2026, global major copper ore supply growth remained limited, and the ore tightness showed no improvement. The latest data showed that spot TC for copper concentrates in China had fallen below -$90/dmt. With long-term contract TC at zero and spot TC declines accelerating, domestic smelters' production profits mainly relied on surging sulphuric acid prices and firm by-product prices of gold, silver, and other metals to compensate. It was reported that current sulphuric acid revenue could already cover smelters' procurement costs for copper concentrates and part of the processing costs, enabling domestic smelters to maintain relatively high operating rates, and the ore tightness had not yet notably transmitted to the smelting side. It is worth noting that sulphuric acid is not only a by-product of pyrometallurgy but also a core production material for SX-EW copper. For every 1 mt of copper produced, 5–6 mt of sulphuric acid is consumed. Sulphuric acid costs account for 40%–50% of total SX-EW copper production costs, and SX-EW copper production accounts for approximately 20% of global mine copper production. Since the beginning of this year, sulphuric acid prices surged sharply due to multiple factors, and ex-China sulphuric acid supply was periodically disrupted, raising concerns that copper supply in some countries could be affected. Focusing on the reasons behind the sulphuric acid price surge: on one hand, since the escalation of the Middle East conflict on February 28, shipping through the Strait of Hormuz has been broadly restricted and has recently faced a dual blockade by Iran and the US. Sulphur exports from the Middle East have been impacted, with the DRC and Zambia being the most concentrated SX-EW copper producing regions that are highly dependent on sulphur imports from the Middle East. As sulphur supply has been constrained, sulphuric acid prices have naturally risen in tandem, not only raising local SX-EW copper production costs but also potentially triggering further production cuts if the Strait of Hormuz blockade continues and sulphur disruption risks escalate. On the other hand, to prioritise domestic spring ploughing phosphate fertiliser production and support new energy industry expansion, China has imposed a phased ban on sulphuric acid exports according to industry sources. Chile has a relatively high dependence on Chinese sulphuric acid, with SX-EW copper accounting for around 20% of its output, and the market is also concerned that Chile's SX-EW copper production may be affected. In addition, against the backdrop of an already fragile copper ore supply, frequent news shocks from outside China recently have undoubtedly intensified market concerns. Last week, market rumours suggested that the full restart of Indonesia's Grasberg copper-gold mine, which declared force majeure in September last year, had been delayed by one year, driving SHFE copper sharply higher in the afternoon of 8 May. However, according to the latest update from Freeport-McMoRan, the company still expects Indonesia's Grasberg copper-gold mine to fully resume production by the end of 2027, reaffirming the plan outlined last month and refuting reports that production resumptions could be delayed to 2028. Furthermore, yesterday Peru declared an emergency energy decree due to a natural gas pipeline explosion. Peru's copper production reached 2.63 million mt in metal content last year, ranking third globally. Copper mining and smelting are relatively sensitive to power stability, and the market is concerned that Peru's energy strain may disrupt local copper supply. Overall, China's copper cathode production remains relatively stable, but some major global miners lowered their full-year production guidance in Q1, the ore tightness persists, sulphuric acid supply — a core raw material for ex-China SX-EW copper — is constrained, and there are multiple supply disruption themes on the copper supply side, which can easily boost copper prices once the macro front stabilises. Global Copper Visible Inventory Divergence: China Destocking Provides Support Last year, driven by the US government's threat to impose additional tariffs on imported copper, global copper continued to flow into the US, causing COMEX copper inventories to accumulate continuously while copper inventories in non-US regions remained low, providing sustained support for copper prices. In February this year, the US Supreme Court struck down most of the tariff measures introduced by the Trump administration in 2025. The Trump administration subsequently turned to Section 122 of the Trade Act of 1974 to push new global tariff policies. On 7 May, the US Court of International Trade issued a ruling stating that the legal basis for imposing a 10% global import tariff was invalid. The tug-of-war between US courts and the Trump administration over tariffs has continued recently, but the market has certain expectations that the US may subsequently impose additional tariffs on imported copper. Under such expectations, the price spread between COMEX copper and LME copper has shown a slight strengthening trend recently, meaning copper in LME warehouses still has the potential to flow to the US. Specifically, COMEX copper inventories have continued to rebound since mid-April, rising from around 590,000 mt to the latest 620,000 mt, again hitting a multi-year high. Correspondingly, LME copper inventories pulled back from around 400,000 mt in mid-April, declining to 397,700 mt on 6 May. They have rebounded with fluctuations recently, but overall inventories have not exceeded the over-12-year high set in mid-April. SHFE copper inventories fell for the eighth consecutive week, currently dropping to 181,300 mt, the lowest since the beginning of the year. Data source: Webstock Inc. Overall, on the macro front, there are currently disagreements in US-Iran negotiations, but both sides continue the ceasefire with no recent signs of escalation in conflict. Energy prices pulled back from late April levels, inflation concerns eased somewhat, the US dollar index was in the doldrums, and combined with the AI boom lifting global stock markets, market risk appetite was moderate, providing a fertile ground for copper prices to strengthen. Focusing on copper's own fundamentals, inventories outside China remained elevated, but significant prior destocking of China inventories provided support. The ore tightness was difficult to reverse, and supply-side narratives were abundant, meaning copper prices may still hold up well. However, it is worth noting that the Middle East situation remains the biggest macro variable, and the policy path following the Fed Chairman's power transition also deserves close attention. (Webstock Composite)
May 12, 2026 20:10 - Grasberg Mine to Resume Production by the End of 2027, LME Copper and SHFE Copper Closed Sharply Higher Overnight [SMM Copper Morning Meeting Minutes]
SMM Morning Meeting Summary: Overnight, LME copper opened at and dipped below $13,693.5/mt, moved sideways at the beginning of the session, then the copper price center fluctuated upward and probed up to $13,969/mt near the end of the session, before fluctuating downward to finally close at $13,920/mt, up 2.84%, with trading volume at 26,800 lots and open interest at 272,000 lots, an increase of 1,201 lots from the previous trading day, indicating bulls adding positions. Overnight, the most-traded SHFE copper 2606 contract opened at 105,500 yuan/mt, dipped to 105,390 yuan/mt at the beginning of the session, then the copper price center gradually shifted upward and touched a high of 107,350 yuan/mt near the end of the session, before fluctuating downward to finally close at 106,770 yuan/mt, up 2.35%, with trading volume at 75,900 lots and open interest at 209,000 lots, an increase of 4,829 lots from the previous trading day, indicating bulls adding positions.
May 12, 2026 09:19