1701results found for 'Aluminium'
Price
News
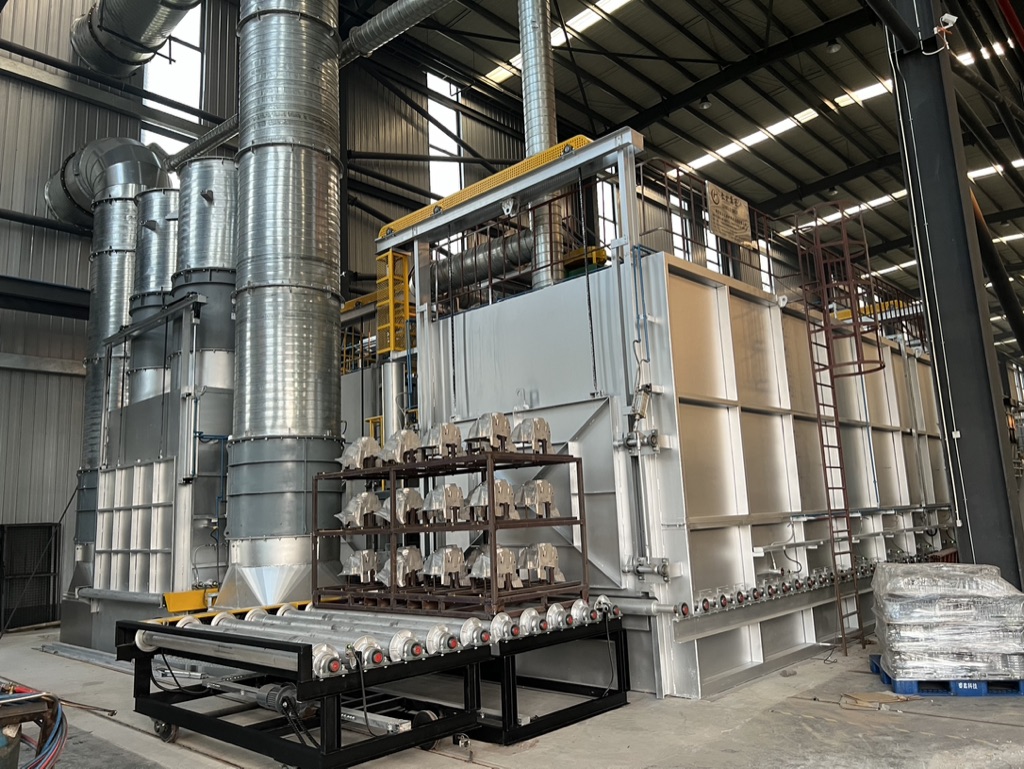 Q3 MJP Hits Record High as Mounting Pressure Weighs on SE Asian Aluminium Billet Transactions in July【SMM Analysis】
As of July 24, premiums for 6063 aluminium billet across major Southeast Asian markets remained broadly stable throughout July, with no adjustments recorded for four consecutive weeks. The ex-works premium for homogenised 6063 aluminium billet in Cambodia averaged $300/mt, while premiums for homogenised billet in Malaysia and Thailand both stood at $262.5/mt. The ex-works premium for non-homogenised 6063 aluminium billet in Thailand was assessed at $222.5/mt, compared with $205/mt in Vietnam. Meanwhile, the CIF Thailand premium for Chinese exports of non-homogenised 6063 aluminium billet was assessed at a range of minus $100/mt to plus $100/mt, with a midpoint of $0/mt. In terms of price movements, premiums for homogenised 6063 aluminium billet in Thailand and Malaysia had already retreated from their previous highs in June compared with May, before stabilising in July. However, stable premiums did not indicate an improvement in market demand. The 2026 Q3 MJP was settled at $395/mt, up $43.50/mt, or approximately 12.4%, from $351.50/mt in Q2, reaching a historical high. As reference prices for Southeast Asian aluminium billet are generally calculated based on the LME Official Cash Settlement, MJP and the applicable premium, the higher MJP further raised the overall procurement cost of locally produced billet and weighed on downstream purchasing interest. At the same time, Chinese aluminium billet exports continued to compete with locally produced material in Southeast Asia. In Thailand, for example, the CIF premium for Chinese non-homogenised 6063 aluminium billet was assessed at minus $100/mt to plus $100/mt, substantially below the ex-works premium of $222.5/mt for locally produced non-homogenised billet. Although the delivery terms and detailed cost structures of the two types of material are not directly comparable, Chinese export cargoes continued to hold a clear price advantage on a delivered basis. According to SMM market research, some Chinese export cargoes consisted of remelted secondary aluminium billet, which carries relatively lower production costs. Other cargoes were processed from imported materials before being re-exported, resulting in a cost structure different from that of conventional export trade. Supported by these cost advantages, purchases of Chinese aluminium billet in Southeast Asia increased, placing additional pressure on orders received by local billet producers. However, as aluminium billet and aluminium ingot are classified under the same aggregated HS code in existing customs statistics, it is currently difficult to quantify billet export growth separately. The assessment is therefore primarily based on feedback collected through SMM market research. On the supply side, renewed tensions in the Middle East continued to disrupt shipping routes between Asia and Europe in July, affecting exports of Southeast Asian aluminium billet to the European market. Some cargoes originally intended for Europe were redirected to domestic and neighbouring regional markets, further increasing the volume that needed to be absorbed within Southeast Asia. On the demand side, growth in local billet consumption remained insufficient to fully absorb both the surplus supply from Southeast Asian producers and the additional material arriving from China. Under the combined pressure of intensifying supply competition, elevated procurement costs and weak end-user demand, overall trading activity in the Southeast Asian aluminium billet market remained subdued in July. Although premiums across major markets had not declined further, buyers slowed their procurement pace and showed stronger bargaining intentions. Looking ahead, Southeast Asian locally produced aluminium billet premiums are unlikely to gain significant upward momentum in the short term, as the Q3 MJP remains elevated, Chinese export cargoes continue to retain a price advantage, and the region’s ability to divert supply to the European market remains constrained. The high MJP will continue to support overall billet prices. However, unless local consumption improves materially, pressure to absorb regional supply is likely to persist, while market transactions are expected to remain weak. To align with buyers’ target transaction levels and compete with the price advantage of Chinese billet exports, some Southeast Asian billet sellers may need to lower their premiums, offer concessions on MJP pricing, or adopt more flexible pricing arrangements based on the prevailing spot MJP to facilitate transactions.
Jul 31, 2026 15:56- Some aluminum plants in the Middle East announce production resumptions, overseas daily average aluminum production up 1.6% MoM [SMM Analysis]
SMM News, July 31: According to SMM statistics, total outside-China aluminum production in July 2026 fell 6.7% YoY, mainly due to a YoY decline in operating rates at Middle East aluminum smelters. Outside-China daily average production rebounded 1.6% MoM, mainly driven by ongoing production resumptions at smelters in the Middle East and Iceland, as well as output increases brought by project ramp-ups and power-on commissioning in Indonesia, Vietnam, and other locations. In July, there were many updates on operating aluminum capacity outside China. The details are as follows: On July 1, an announcement on Hydro’s official website showed that the Slovalco aluminum smelter had reached an agreement with the Slovak government, allowing it to resume production of 75,000 mt of aluminum capacity, with production expected to start in 2026 Q4. On July 2, according to overseas media reports, Magnitude 7 Metals will restart the No. 1 potline at its aluminum smelter in Marston, Missouri, adding 75,000 mt/year of primary aluminum capacity by the end of 2026. On July 2, EGA announced that its plant in Al Taweelah had made progress in restoring production: anode removal for all pots had been fully completed; pot cleaning was about 90% complete; and solidified aluminum blocks in over 20% of pots had been cleared. On May 26, the first repaired pot was successfully restarted; as of July 2, 89 pots were in operation (1,262 pots in total). On July 3, Vedanta Aluminium released a production report showing that in FY27 (2026 Q2), aluminum production at the Balco smelter reached 168,000 mt, up 10% QoQ and up 17% YoY, mainly benefiting from trial production output from expanded capacity. On July 15, Rio Tinto released its Q2 results report, noting continued capacity increases at Kitimat, NZAS, and AP60. The last two potlines at the Arvida aluminum smelter were closed as planned in June, and Arvida AP60 is expected to reach full production by year-end. On July 16, Alcoa released its Q2 results report. Its production reached 636,000 mt, up 5% QoQ, mainly benefiting from the completion of production resumptions at the San Ciprián smelter in Spain, ongoing production resumptions at the Alumar smelter in Brazil, and the completion of production resumptions at the Lista smelter in Norway and the Portland smelter in Australia. Looking ahead to August 2026, production resumptions in the Middle East are expected to continue; new projects previously commissioned in Indonesia and Vietnam are expected to continue ramping up production; and Balco’s expanded capacity in India is expected to continue ramping up. Although the Middle East conflict has flared up again, market feedback indicates it has not affected smelter production again. Overall, outside-China aluminum production is expected to maintain the MoM growth trend in the short term. However, recent market rumors suggest that construction progress for some aluminum projects in the Middle East and Indonesia has fallen short of expectations, and continued attention should be paid to subsequent announcements from relevant smelters in the Middle East, Indonesia, and India. [Data Source Statement: Except for public information, all other data are processed by SMM based on public information, market communication, and SMM’s internal database models, for reference only and not constituting decision-making advice.] Data source: SMM (Guo Mingxin 021-20707919)
Jul 31, 2026 10:59 - South Africa Proposes Adding Lithium and Other Battery Minerals to Automotive Incentive Scheme
South Africa’s International Trade Administration Commission (ITAC) has proposed expanding the country’s automotive incentive framework to include minerals used in electric-vehicle battery manufacturing, supporting deeper localisation of the domestic automotive and battery-material supply chains. Under the proposal, the existing list of eligible standard materials including aluminium, steel and platinum-group metals would be expanded to cover lithium, graphite, cobalt, copper, iron and rare earths. Eligible materials would need to originate from member states of the Southern African Customs Union (SACU) or Southern African Development Community (SADC). The proposed framework would recognise 50% of the value of qualifying EV battery materials as local content, potentially improving producers’ eligibility for automotive-sector incentives. The policy aligns with the South African Automotive Master Plan 2035, which aims to increase vehicle production, local content and investment as the industry transitions toward electric mobility. Stakeholders were given four weeks from the notice date to submit comments, meaning the final scope and implementation schedule remain subject to consultation. SMM comments: The proposal represents a demand-side approach to developing Africa’s battery supply chain, contrasting with Zimbabwe’s supply side policy of restricting concentrate exports to force domestic processing. If implemented, South Africa could emerge as a regional battery material processing or manufacturing hub sourcing feedstock from neighbouring SADC producers, including Zimbabwe and Namibia. However, the near-term impact on regional lithium trade flows is likely to be limited. Major Zimbabwean lithium assets including Arcadia, Bikita and Sabi Star are controlled by Chinese companies with established China-linked processing and offtake arrangements. It also remains unclear whether spodumene concentrate would qualify directly as an eligible battery material or whether further conversion into lithium sulphate, carbonate or hydroxide would be required. The final rules should therefore be monitored alongside Zimbabwe’s planned January 2027 lithium concentrate export deadline, as the two policies could influence future investment and trade flows within Southern Africa.
Jul 30, 2026 22:20 - Default Values Widen CBAM Exposure Gaps for HS7601; Mozambique Leads Total Exposure While China Ranks High【SMM Analysis】
Following the start of the definitive phase of the EU Carbon Border Adjustment Mechanism (CBAM) in 2026, differences in country-specific default values , default production routes and corresponding benchmarks have begun to translate into significantly different theoretical certificate exposures for unwrought aluminium. SMM analysed EU-27 imports of unwrought aluminium under HS/CN 7601 from non-EU origins and matched the trade data with the 2026 default value, default production route and CBAM benchmark assigned to each origin. The theoretical unit certificate exposure in this analysis is calculated as: 2026 theoretical unit certificate exposure = 2026 default value − benchmark × 97.5% × cross-sectoral correction factor The cross-sectoral correction factor, or CSCF, is provisionally assumed to be 1. The calculation does not deduct any qualifying carbon price effectively paid in the country of origin. The results therefore indicate the relative CBAM exposure of different origins under the default-value scenario. They do not represent the final number of certificates that EU importers will be required to surrender or the final monetary cost. EU-27 unwrought aluminium imports rose 7.0% in 2025 According to SMM calculations, EU-27 imports of unwrought aluminium under HS/CN 7601 from non-EU origins reached approximately 7.63 million tonnes in 2025 , up from 7.13 million tonnes in 2024. This represented an increase of about 502,200 tonnes, or 7.0% year on year . Of the 2025 total, approximately 4.56 million tonnes originated from countries subject to CBAM, accounting for 59.7% of total imports. Imports from CBAM-exempt origins, including Norway, Iceland and Switzerland, amounted to approximately 3.05 million tonnes , representing around 40.0% of the total. A further 25,800 tonnes were recorded without a specified origin and were excluded from the country-level exposure ranking. Applying the 2026 default values and benchmarks to the 2025 trade structure produces an estimated theoretical certificate exposure of approximately 4.09 million tCO₂e for imports from CBAM-covered origins. The trade-weighted average unit exposure was approximately 0.898 tCO₂e per tonne of product . As 2025 remained within the CBAM transitional period, these figures are scenario-based estimates using 2025 trade volumes and the 2026 calculation rules. They do not represent actual certificate obligations for 2025. Primary aluminium route accounted for more than 99% of theoretical exposure The primary aluminium route dominated both CBAM-covered import volumes and theoretical certificate exposure. In 2025, imports assigned to the primary aluminium route totalled approximately 4.46 million tonnes , accounting for 97.8% of imports from CBAM-covered origins. Their theoretical certificate exposure reached approximately 4.06 million tCO₂e , representing 99.3% of the total exposure. The trade-weighted average unit exposure for the primary aluminium route was approximately 0.912 tCO₂e per tonne of product . By comparison, imports assigned to the secondary aluminium route amounted to approximately 99,500 tonnes, or 2.2% of CBAM-covered imports. Their theoretical certificate exposure was approximately 30,600 tCO₂e, with an average unit exposure of around 0.307 tCO₂e per tonne . The gap between the two routes reflects differences in both country default values and the applicable benchmarks. For HS/CN 7601, the benchmark used for the primary aluminium route is 1.423 tCO₂e per tonne , compared with 0.091 tCO₂e per tonne for the secondary aluminium route. This means that, under a default-value declaration scenario, the theoretical CBAM exposure of EU-27 unwrought aluminium imports remains highly concentrated in primary aluminium supply. Mozambique recorded the highest unit exposure, with China also ranking near the top The results show a clear divergence in theoretical unit exposure among origin countries. Mozambique recorded the highest unit exposure among major origins with a country-specific default value, at approximately 2.130 tCO₂e per tonne of product . China followed at approximately 1.913 tCO₂e per tonne , placing it among the origins with the highest default-value-based unit exposure. South Africa recorded an estimated unit exposure of approximately 1.207 tCO₂e per tonne , followed by Russia at 0.989 tCO₂e and Canada at 0.769 tCO₂e. Bahrain, the United Arab Emirates, India, the United Kingdom, Egypt and Kazakhstan share similar default values under the primary aluminium route, resulting in unit exposure of approximately 0.670 tCO₂e per tonne . Australia, Brazil, Malaysia, Oman, Qatar, Saudi Arabia and the United States recorded unit exposure of approximately 0.483 tCO₂e per tonne . Origins assigned to the secondary aluminium route generally recorded approximately 0.307 tCO₂e per tonne . A high unit exposure does not necessarily mean that an origin faces the greatest aggregate impact. Total exposure also depends on the volume of trade with the EU-27. China illustrates this distinction. EU-27 imports of HS/CN 7601 products from China reached approximately 12,400 tonnes in 2025 , up 24.3% year on year. This corresponded to theoretical certificate exposure of about 23,700 tCO₂e . China therefore ranked near the top on a unit basis, but its comparatively limited shipment volume to the EU-27 kept its aggregate exposure well below that of Mozambique, Canada and several major Gulf suppliers. Mozambique’s total theoretical exposure reached 1.34 million tCO₂e After incorporating 2025 import volumes, Mozambique emerged as the origin with the highest aggregate theoretical certificate exposure. EU-27 imports from Mozambique reached approximately 628,000 tonnes in 2025 , up 17.5% year on year. Based on unit exposure of 2.130 tCO₂e per tonne, its total theoretical exposure was approximately 1.34 million tCO₂e . Mozambique alone accounted for 32.7% of the theoretical exposure associated with CBAM-covered origins. However, the above total exposure is a static estimate based on 2025 trade volumes. Power supply constraints may limit Mozambique’s aluminium smelting capacity and output in 2026–2027, potentially reducing its exports to the EU. As a result, its actual near-term aggregate CBAM exposure may not reach the theoretical level estimated using 2025 trade volumes. Canada supplied approximately 682,800 tonnes to the EU-27 in 2025. Although its unit exposure was considerably lower than Mozambique’s, its larger trade volume lifted its aggregate theoretical exposure to approximately 524,800 tCO₂e , equivalent to 12.8% of the total. Bahrain, the United Arab Emirates, Russia and South Africa recorded theoretical total exposures of approximately 350,900 tCO₂e, 329,300 tCO₂e, 322,200 tCO₂e and 263,600 tCO₂e, respectively. Mozambique, Canada, Bahrain, the United Arab Emirates, Russia and South Africa together accounted for approximately 76.4% of total theoretical certificate exposure. Mozambique’s position was driven by the combination of a high unit default-value exposure and substantial trade volume. Canada’s unit exposure was not among the very highest, but its large and rapidly increasing export volume significantly amplified its aggregate impact. Four-quadrant analysis places China in the “high intensity, low trade volume” category A four-quadrant analysis using 2025 EU-27 import volume on the horizontal axis and 2026 theoretical unit certificate exposure on the vertical axis provides a clearer view of the combined influence of carbon intensity and trade scale. The core high-exposure quadrant includes Mozambique, Canada, Bahrain, the United Arab Emirates, Russia, South Africa, India and the United Kingdom. These origins combine comparatively large trade volumes with relatively high unit exposure and are the main contributors to aggregate CBAM exposure for EU-27 unwrought aluminium imports. China is the most prominent origin in the high intensity, low trade volume quadrant . Its theoretical unit exposure of approximately 1.913 tCO₂e per tonne is second only to Mozambique, but its current export volume to the EU-27 remains comparatively limited. Ukraine and South Korea are among the origins in the trade-volume-driven quadrant . Both are assigned to the secondary aluminium route and have relatively low unit exposure, but their larger trade volumes increase their aggregate exposure compared with other secondary-route origins. Vietnam, Morocco, Serbia, Bolivia and Mexico are among the origins in the low-exposure quadrant , reflecting both lower unit exposure and limited trade volumes. For Vietnam, HS/CN 7601 unwrought aluminium is assigned to the secondary aluminium default route, resulting in theoretical unit certificate exposure of approximately 0.307 tCO₂e per tonne in 2026, significantly below that of most origins assigned to the primary aluminium route. EU-27 imports from Vietnam amounted to approximately 7,100 tonnes in 2025, down around 27.1% year on year, corresponding to theoretical total certificate exposure of about 2,200 tCO₂e. Vietnam’s overall CBAM exposure therefore remains relatively limited at present. However, should its exports to the EU expand in the future, access to and verification of actual emissions data will remain an important factor affecting the relative competitiveness of Vietnamese products. The quadrant thresholds are analytical dividing lines based on the median values of CBAM-covered origins with actual trade. They do not represent regulatory thresholds set by the EU. Theoretical exposure reached approximately 642,400 tCO₂e in Q1 2026 In the first quarter of 2026, EU-27 imports of unwrought aluminium under HS/CN 7601 from non-EU origins reached approximately 1.52 million tonnes , with a total import value of around €4.36 billion . The average import value was approximately €2,873 per tonne . Imports from CBAM-covered origins amounted to approximately 782,800 tonnes , accounting for 51.6% of total imports. Imports from CBAM-exempt origins reached around 733,000 tonnes, or 48.4%. Based on the 2026 default values and benchmarks, imports from CBAM-covered origins generated theoretical certificate exposure of approximately 642,400 tCO₂e during the quarter. Mozambique remained the largest contributor, with theoretical exposure of around 150,500 tCO₂e. Canada followed with approximately 86,800 tCO₂e, the United Arab Emirates with 82,100 tCO₂e, Bahrain with 63,400 tCO₂e and South Africa with 56,200 tCO₂e. As the analysis does not include Q1 2025 comparison data, no year-on-year conclusion has been drawn for Q1 2026 import volumes or exposure. The quarterly figures are used primarily to illustrate the origin structure during the initial stage of the definitive CBAM period. Access to and verification of actual emissions data could become an important competitiveness factor Country default values are fallback parameters applied when producers are unable to provide actual emissions data that meet EU requirements. They do not necessarily reflect the actual carbon intensity of a specific producer or shipment. For origins with relatively high default-value exposure, including China, Mozambique, South Africa and Russia, producers whose actual embedded emissions are materially lower than the applicable country default value could reduce the certificate exposure faced by EU importers by establishing robust emissions-monitoring systems and providing complete, verified emissions data. Conversely, where suppliers are unable to provide emissions information that is complete, traceable and compliant with EU requirements, importers may have to rely on the relevant country default value. A higher default value could consequently affect supplier selection, purchase negotiations and long-term contract arrangements. The final number of certificates to be surrendered will also depend on actual embedded emissions, production-route classification, data verification and any qualifying carbon price effectively paid in the country of origin. The actual CBAM cost will additionally depend on the CBAM certificate price, which is linked to EU Emissions Trading System allowance prices. The theoretical certificate exposure calculated in this analysis should therefore not be interpreted directly as either the final certificate obligation or the final CBAM cost. Overall, the impact of CBAM on trade in HS/CN 7601 unwrought aluminium will not be determined by country default values alone. Unit certificate exposure, trade scale, actual emissions and the availability of reliable carbon data will jointly shape the competitive position of different origins and producers in the EU market. As the definitive phase progresses, differences in low-carbon production capability, emissions-data management and verification capacity are likely to become increasingly visible in procurement decisions, export competitiveness and trade flows. Data note: The trade scope covers EU-27 imports of unwrought aluminium under HS/CN 7601 from non-EU origins. CBAM-exempt origins, including Norway, Iceland and Switzerland, are included in total import statistics but excluded from theoretical certificate exposure. Origins without a country-specific default value are assigned the applicable value for “Other Countries and Territories.” Unspecified origins are excluded from the country ranking. Theoretical exposure does not deduct qualifying carbon prices paid in third countries. Source: EU-27 import data, EU CBAM default values and benchmarks; compiled by SMM.
Jul 30, 2026 09:09 - [SMM Steel Market Morning News] The US Fed announced for the fifth consecutive time this year that it will keep interest rates unchanged.
US Fed announced for the fifth consecutive time this year to maintain interest rates unchanged.
Jul 30, 2026 07:30 - Copper Prices Edge Lower Before Fed Decision, Aluminium Rises on Supply Fears
Copper prices edged lower on Wednesday as investors remained cautious ahead of the U.S. Federal Reserve's interest rate decision, while signs of easing supply tightness in China, the world's largest copper consumer, also weighed on sentiment. In contrast, aluminium prices gained support as renewed fighting in the Middle East raised concerns over potential supply disruptions. Benchmark three-month copper on the London Metal Exchange (LME) fell 0.4% to $13,631 per metric ton by 1002 GMT, although the contract remained above its 50-day moving average of $13,576, a key technical support level watched by traders. The U.S. dollar hovered near one-month highs as market participants awaited the Fed's policy announcement for further guidance on the interest rate outlook. A stronger dollar typically makes dollar-denominated metals more expensive for buyers using other currencies, which can weigh on demand. Markets were pricing in roughly a 30% probability of a 25-basis-point interest rate increase, contributing to subdued trading activity across base metals.
Jul 29, 2026 23:40
Announcements
SMM update and adjust the monthly alumina output data for May 2026 to enhance accuracy, stability, and market reference value. Apologies for any inconvenience.
DataJun 22, 2026 19:49Against this backdrop, SMM will begin publishing the US Midwest DDP aluminum premium starting February 27, 2026. Through daily market communication, SMM will introduce ......
PriceFeb 13, 2026 15:04COMEX Inventory Data Date Adjustment
DataFeb 4, 2026 15:26
Events
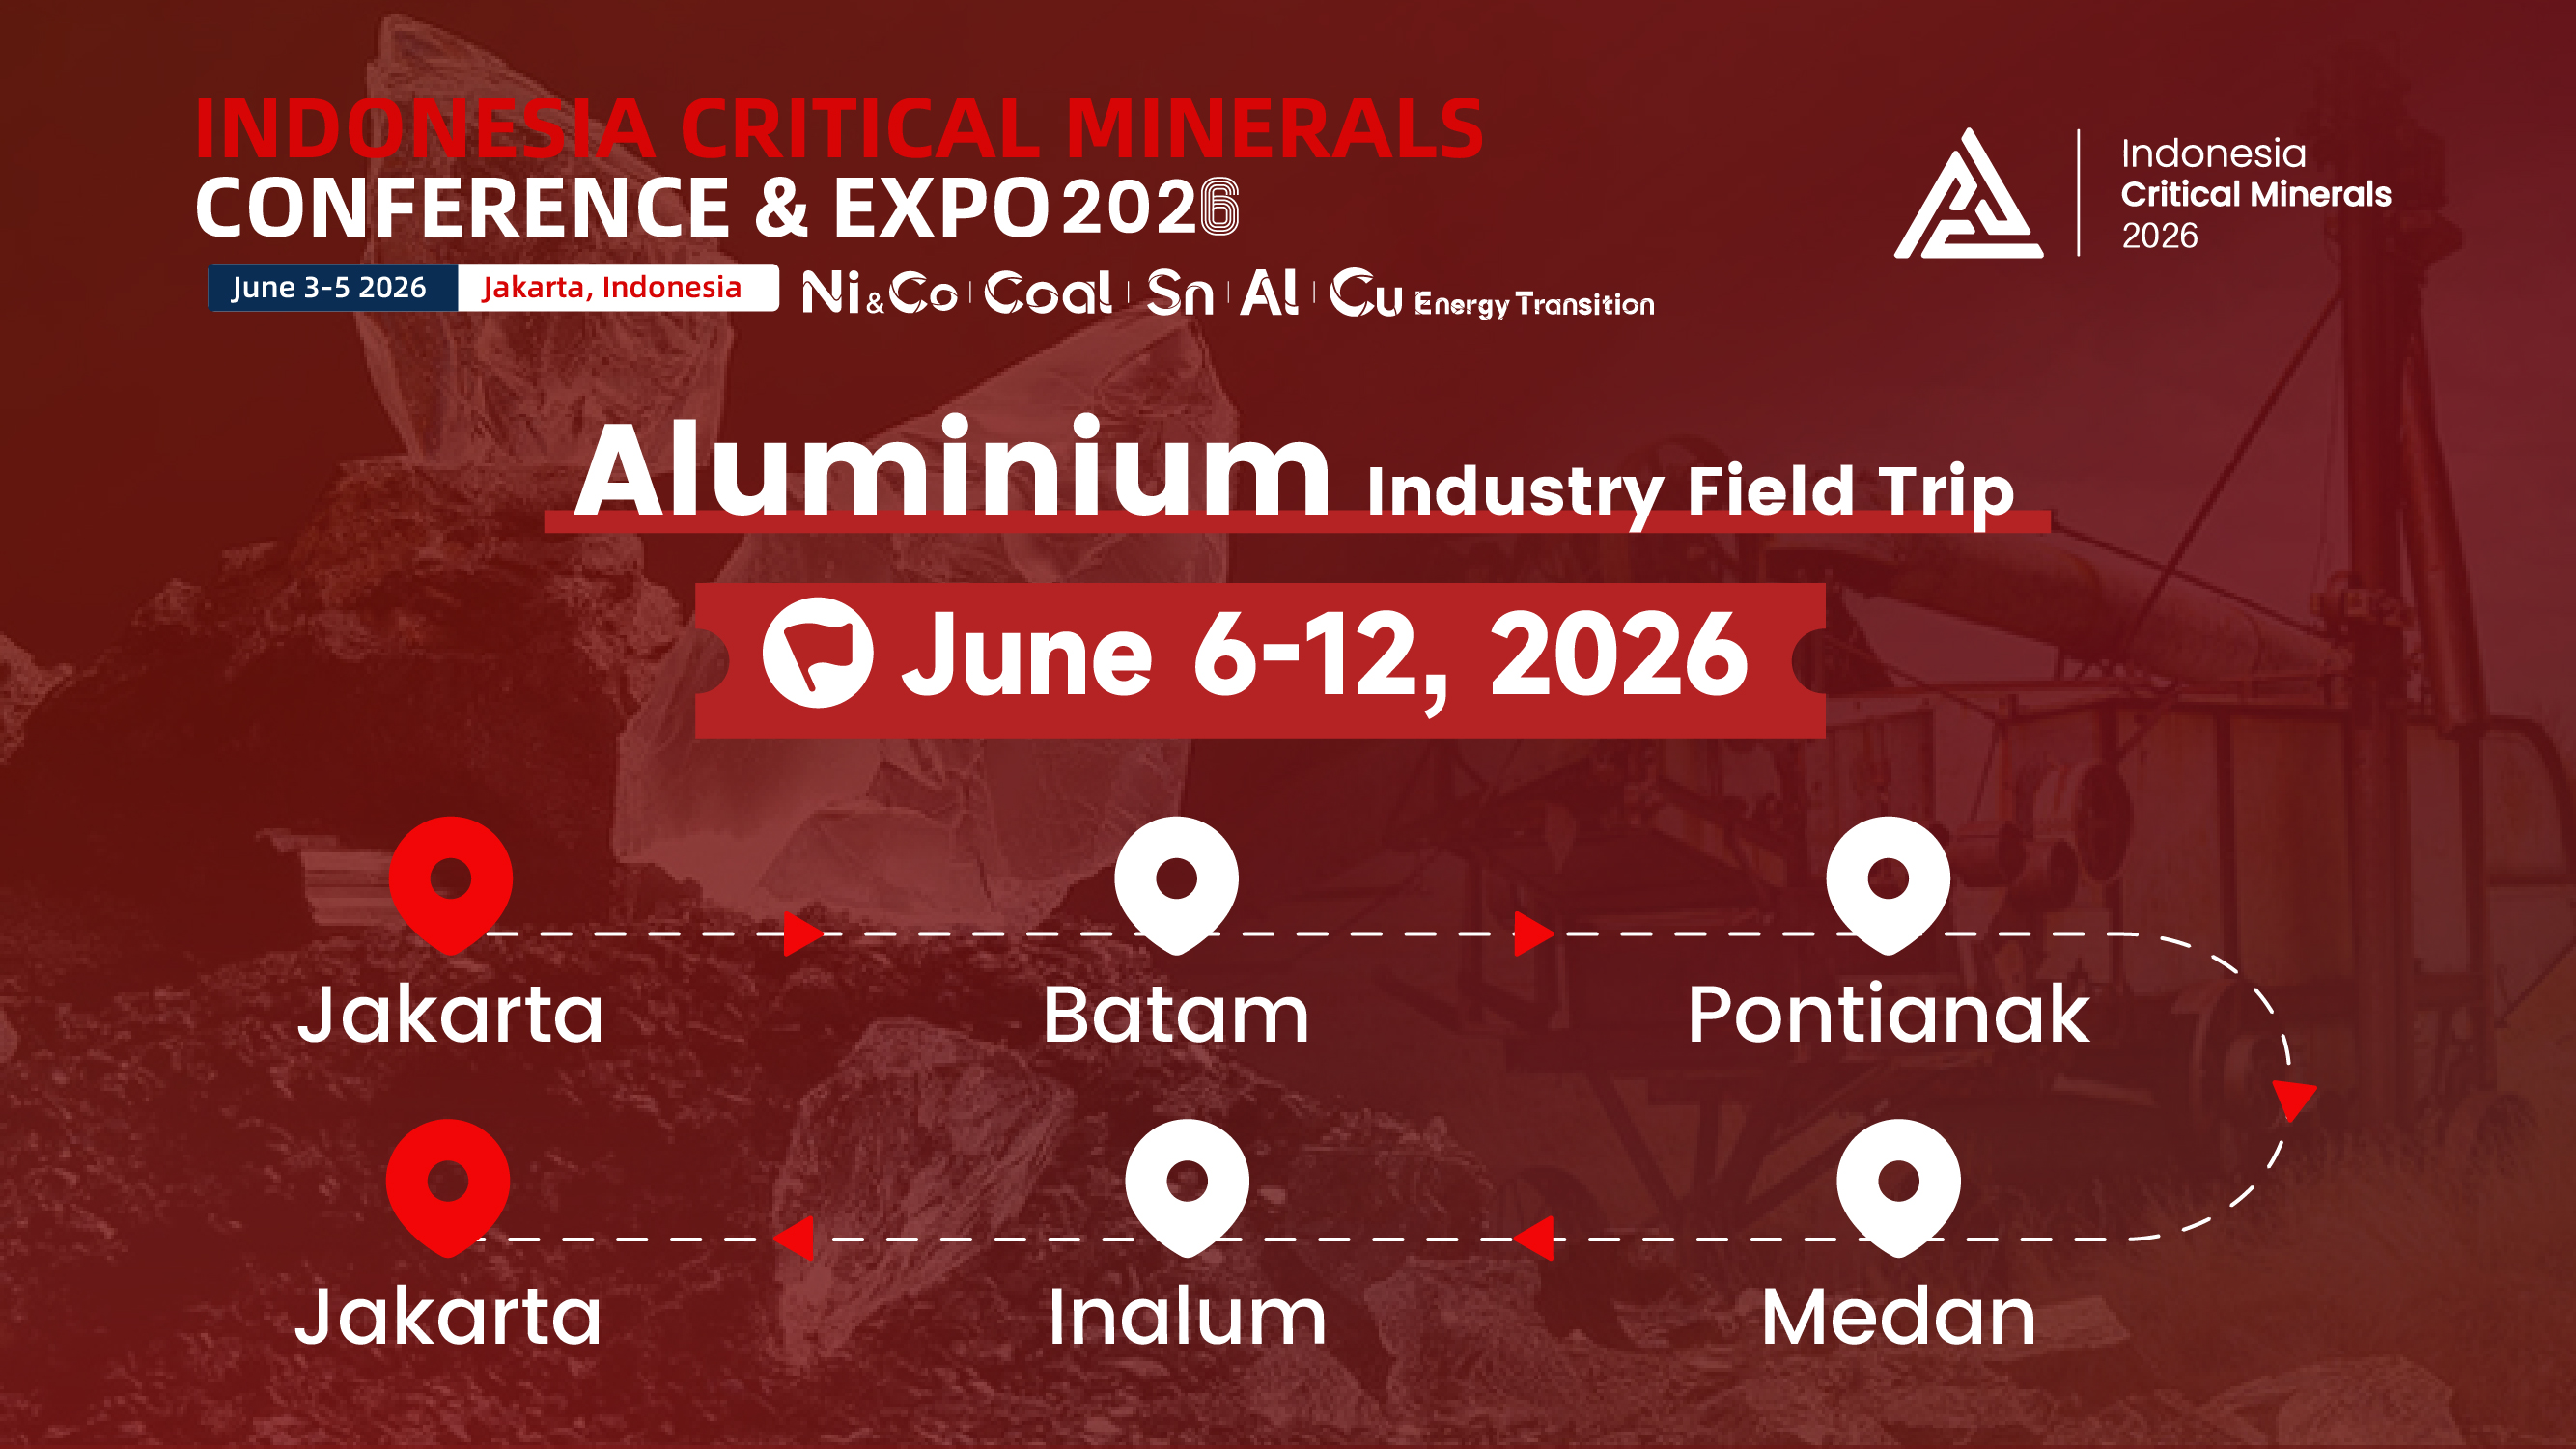 Field TripJun 6 - 12, 2026 (GMT+8)Jakarta
 WebinarMar 11, 16:00 - 23:59 (GMT+8)